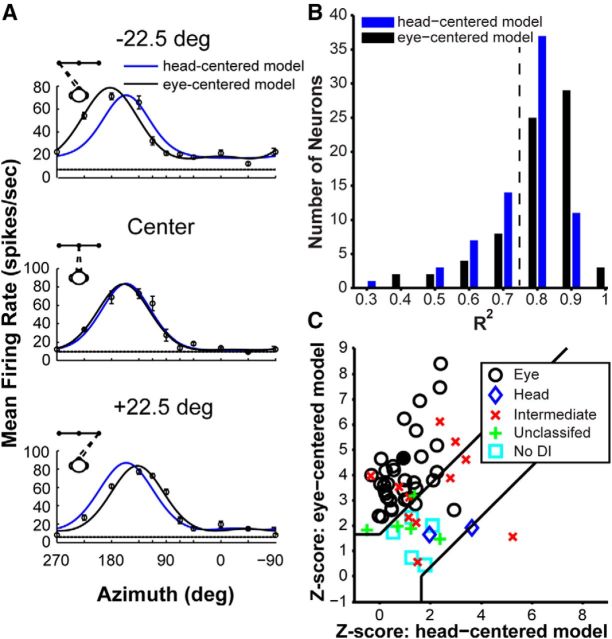
Figure 8.
Quantification of reference frames by model fitting. A, Heading tuning curves (mean ± SEM firing rate) for an example V6 neuron (filled circle in C) measured at three different eye positions, along with fits of the eye-centered (black curves) and head-centered (blue curves) models. B, Distribution of R2 values for the eye-centered model (black bars) and the head-centered model (blue bars), for all neurons recorded during the reference frame protocol (n = 73). The dotted black vertical line represents R2 = 0.75. C, Z-transformed partial correlation coefficients for the eye- and head-centered model fits. Data are shown for neurons with curve fits having R2 ≥ 0.75 for either the eye- or head- centered model (n = 58). Data points falling in the top left region represent neurons that are classified as eye-centered, whereas data points falling in the bottom right region are classified as head-centered neurons. Data points falling between the lines are considered unclassified. The different markers indicate neuron classification based on the DI bootstrap analysis: black circles denote eye-centered cells, blue diamonds denote head-centered cells, red × symbols denote intermediate (between eye- and head-centered) neurons, green + symbols denote neurons that are considered unclassified, and cyan squares indicate neurons for which the DI could not be computed.

