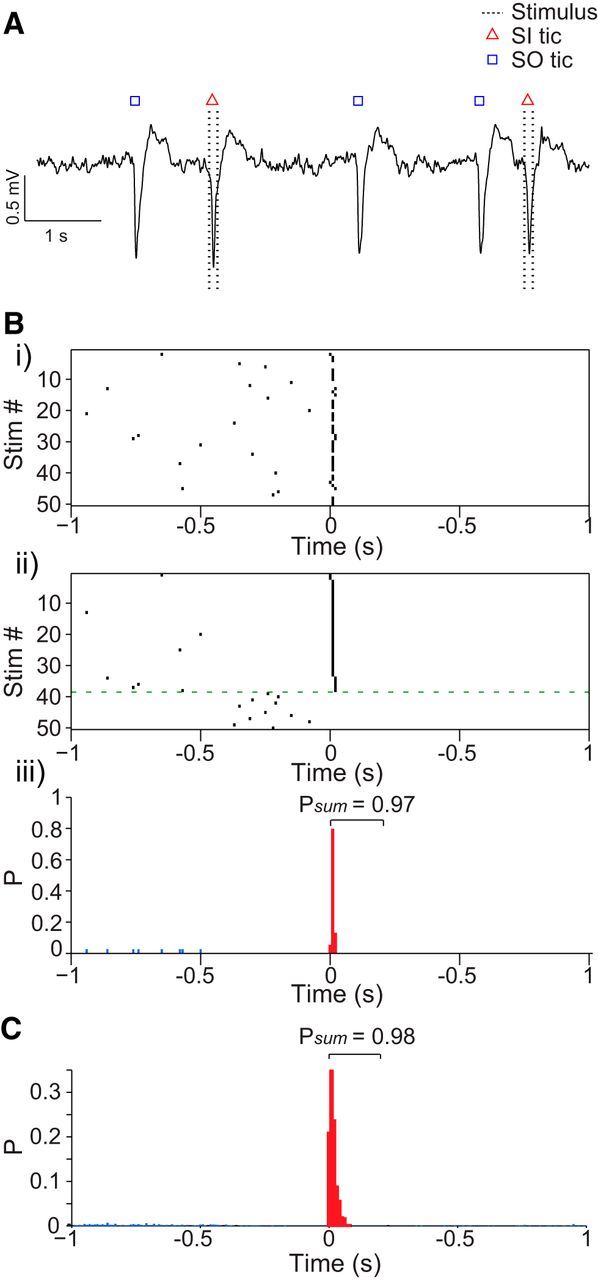
Figure 3.

Cortical stimulation induces tics. A, Short LFP trace during the TP including both SO and SI tics. B, Single session tic formation after stimulation: peristimulus tic raster (i) and the same raster sorted according to the latency between stimulation onset and the induced tic (ii). The green dotted line separates trials in which a tic appeared <0.5 s before the stimulation. iii, Peristimulus tic histogram of the trials above the green line. The colored bars represent SI (red; up to 200 ms after stimulation onset) and SO (blue) tics. Psum denotes the total probability for a tic within the defined window . C, Population peristimulus tic histogram.
