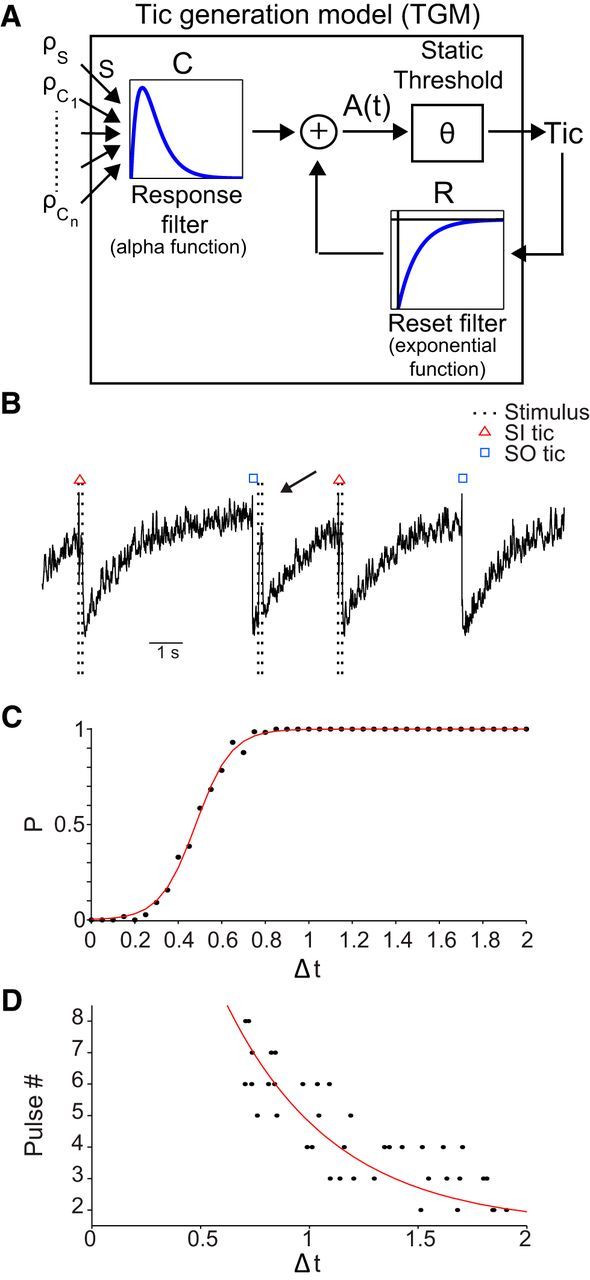
Figure 8.

Tic generation model. A, Schematic illustration of the TGM. B, Example of TGM generated tics during a stimulation period. The arrow points to a stimulation burst that did not induce an SI tic as a result of a preceding SO tic. C, The mean probability of a stimulation leading to a tic as a function of latency from the preceding tic (bin size, 0.05 s). Red line, Sigmoid curve fitting. D, The number of stimulation pulses required to elicit an SI tic as a function of latency from the previous tic (random tics are presented). Red line, Exponential curve fitting. The simulation parameters used throughout the figure: AR = 0.7, AC = 0.01; τR = 1400 ms, τc = 10 ms, S = 3, stimulation burst: 20 stimuli, 167 Hz.
