Figure 1.

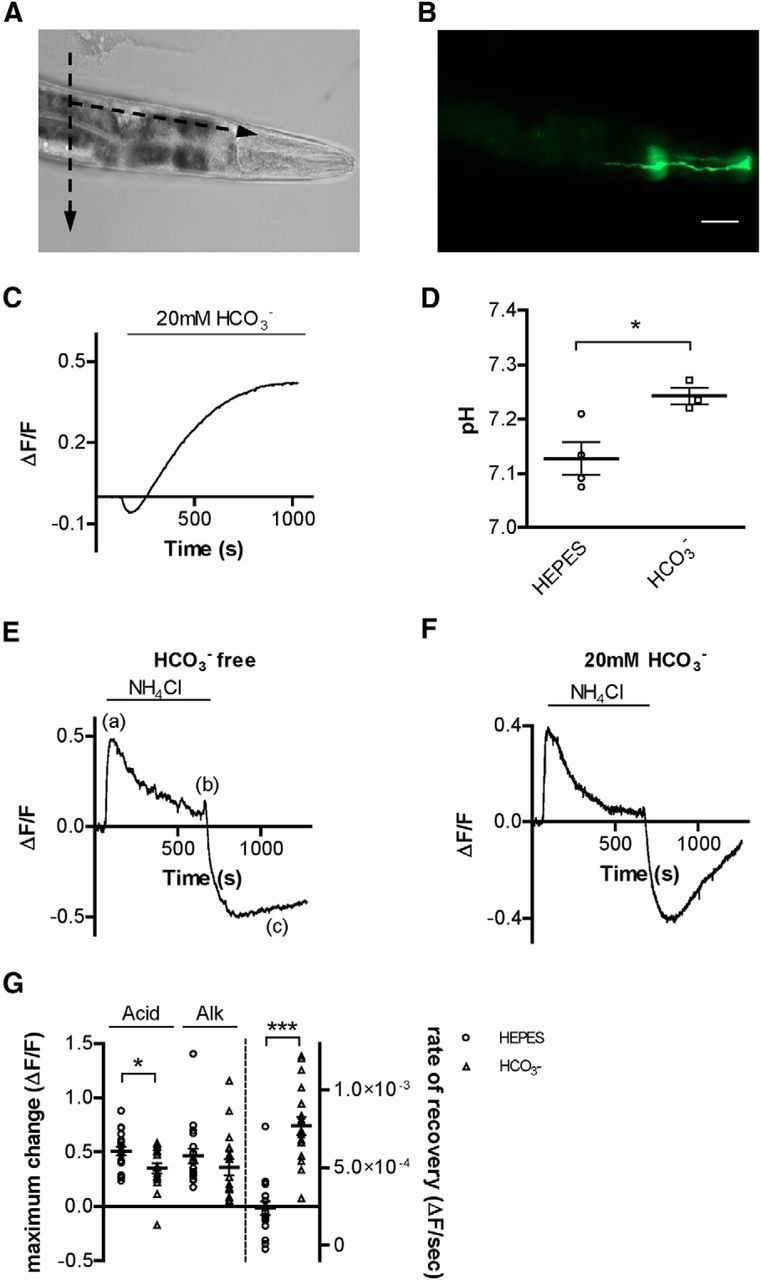
C. elegans AMsh glia buffer intracellular pH via HCO3− transport. A, Bright-field image of C. elegans immobilized on a glass slide. Dashed arrows indicate the direction of the cuts that were made with a glass micropipette before pHlourin pH imaging experiments. B, Fluorescent image of the same animal as in A, showing the pHlourin-mediated fluorescence in an AMsh cell. Scale bars, A, B: 50 μm. C, Representative trace of pHlourin fluorescence in AMsh glia before and after perfusion with a solution containing 20 mm HCO3−. The intracellular pH of glia was alkalized following the perfusion with HCO3−. Data from this trace were used in the analysis shown in Figure 2C. D, Average resting pH of AMsh cells in either the absence (7.13 ± 0.03, n = 4 cells) or presence (7.24 ± 0.02, n = 3 cells) of HCO3−, as determined via nigericin calibration. E, F, Representative traces from NH4Cl acid pulse experiments in AMsh glia in the absence (E) and presence (F) of HCO3−. (a), (b), and (c) indicate the changes of intracellular pH associated with addition (a) and removal (b) of NH4Cl, and the recovery from acid load (c). G, The extent of acidification (Acid, left bars) upon removal of NH4Cl in the AMsh glia cytosol is higher in HEPES buffer alone (ΔF/F = absolute change of 0.51 ± 0.04, n = 18 cells) compared with experiments done in the presence of HCO3− (ΔF/F = 0.35 ± 0.05, n = 18 cells). However, the extent of alkalization (Alk, middle bars) upon NH4Cl application was similar in HEPES buffer alone (ΔF/F = 0.36 ± 0.07, n = 18 cells) and 20 mm HCO3− (ΔF/F = 0.47 ± 0.07, n = 18 cells). The rate of recovery from acid load (Acid recovery, right bars) is significantly higher in the presence of 20 mm HCO3− (ΔF/F/s = 7.68 × 10⁻⁴ ± 5.92 × 10⁻⁵) compared with HEPES buffer alone (ΔF/F/s = 2.40 × 10⁻⁴ ± 4.31 × 10⁻⁵). Data are mean ± SEM. *p < 0.05 (Student's t test). ***p < 0.0001 (Student's t test).
