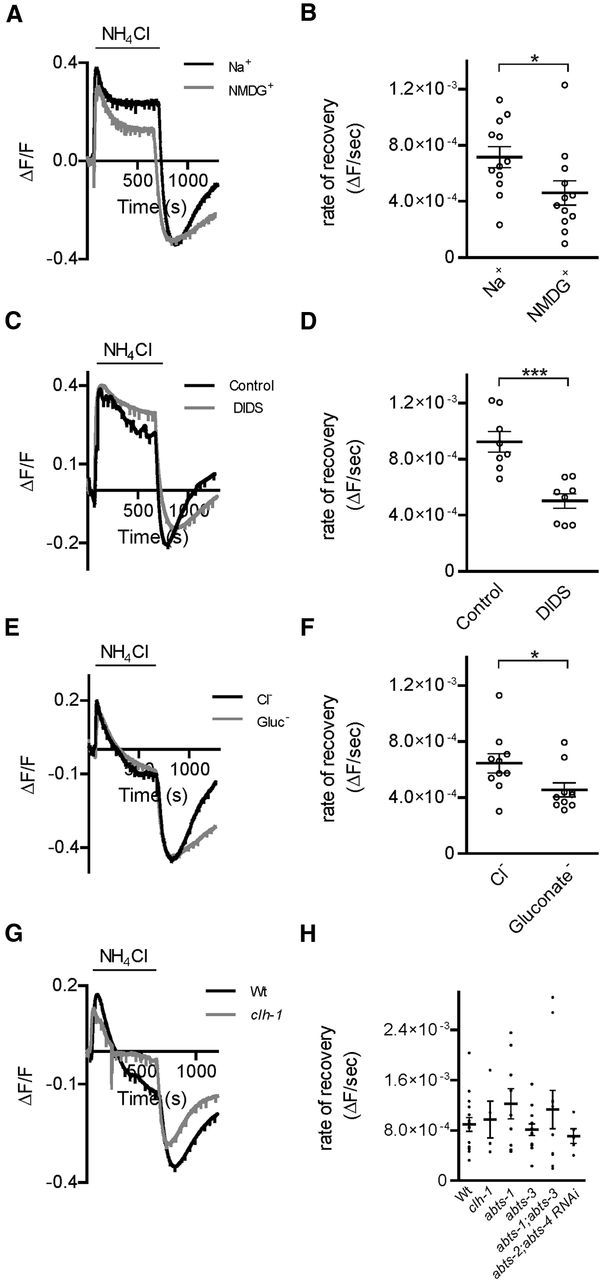
Figure 4.

Acid load recovery in AMsh cells involves a Na+, Cl−, and DIDS-sensitive mechanism independent of CLH-1. A, Representative traces from NH4Cl acid pulse experiments in extracellular buffer with 20 mm HCO3−, in the presence (Na+, black trace) and in the absence (NMDG+, gray trace) of extracellular Na+. B, The rate of recovery after the NH4Cl-mediated acid load is significantly decreased in the absence of Na+ (NMDG+, ΔF/F/s = 4.60 × 10⁻⁴ ± 8.69 × 10⁻⁵, n = 12 cells) compared with in the presence of Na+ (ΔF/F/s = 7.16 × 10⁻⁴ ± 7.53 × 10⁻⁵, n = 12 cells). C, Same as in A, in the absence (control, black trace) and in the presence of DIDS (250 μm, DIDS, gray trace). D, The average rate of recovery from an acid load after an NH4Cl acid pulse in 20 mm HCO3− is significantly decreased in the presence of DIDS (DIDS, ΔF/F/s = 5.02 × 10⁻⁴ ± 5.33 × 10⁻⁵, n = 8 cells) compared with control conditions (control, ΔF/F/s = 9.24 × 10⁻⁴ ± 7.31 × 10⁻⁵, n = 8 cells). E, Representative traces from NH4Cl acid pulse experiments in extracellular buffer with 20 mm HCO3, in both the presence (Cl−, black trace) and absence (gluconate−, gray trace) of Cl−. F, The average rate of recovery from acid load after an NH4Cl pulse is significantly decreased in the absence of Cl− (gluconate−, ΔF/F/s = 4.56 × 10⁻⁴ ± 5.00 × 10⁻⁵ n = 10 cells) compared with control (Cl−, ΔF/F/s = 6.44 × 10⁻⁴ ± 6.90 × 10⁻⁵, n = 10 cells). *p < 0.05 (Student's t test). G, Representative traces from NH4Cl acid pulse experiments in extracellular buffer with 20 mm HCO3, in glia from wild-type (Wt, black trace) and clh-1 (gray trace) animals. H, The average rate of recovery from an acid load after an NH4Cl acid pulse in 20 mm HCO3− is not significantly different between wild-type animals (Wt, ΔF/F/s = 8.93 × 10⁻⁴ ± 1.09 × 10⁻⁴, n = 16 cells), clh-1 (ΔF/F/s = 9.72 × 10⁻⁴ ± 2.94 × 10⁻⁴, n = 4 cells), abts-1 (ΔF/F/s = 1.22 × 10⁻³ ± 2.40 × 10⁻⁴, n = 9 cells), abts-3 (ΔF/F/s = 8.11 × 10⁻⁴ ± 9.13 × 10⁻⁵, n = 13 cells), abts-1;abts-3 (ΔF/F/s = 1.13 × 10⁻³ ± 3.06 × 10⁻⁴, n = 10 cells) knock-out animals, and pT02B11.3:abts-2;abts-4 RNAi animals (abts-2;abts-4 RNAi, ΔF/F/s = 7.09 × 10⁻⁴ ± 1.17 × 10⁻⁴, n = 5 cells). p = 0.4916 (one-way ANOVA). ***p < 0.001, Student's t test. Data are mean ± SEM.
