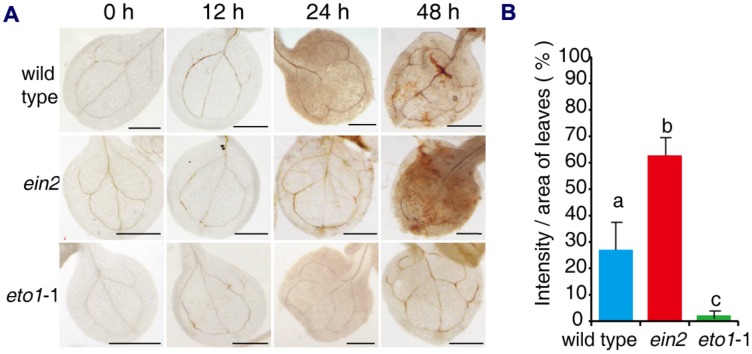
FIGURE 3.
Histochemical detection of H2O2 in leaves of mutants after treatment with FB1. (A) Representative leaves of wild-type, ein2, and eto1-1 seedlings stained with DAB after treatment with 0.5 μM FB1 for the indicated times. (B) Quantification of DAB staining in leaves treated with FB1 for 48 h. H2O2 deposits were quantified by measuring the intensity of DAB staining per unit area of leaves, using Image J. At least six leaves per genotype were analyzed for each time point and the experiments were repeated three times with similar results. Values represent means ± SD (n = 6). Data sets marked with different letters indicate significant differences assessed by Student–Newman–Keul test (P < 0.05).

