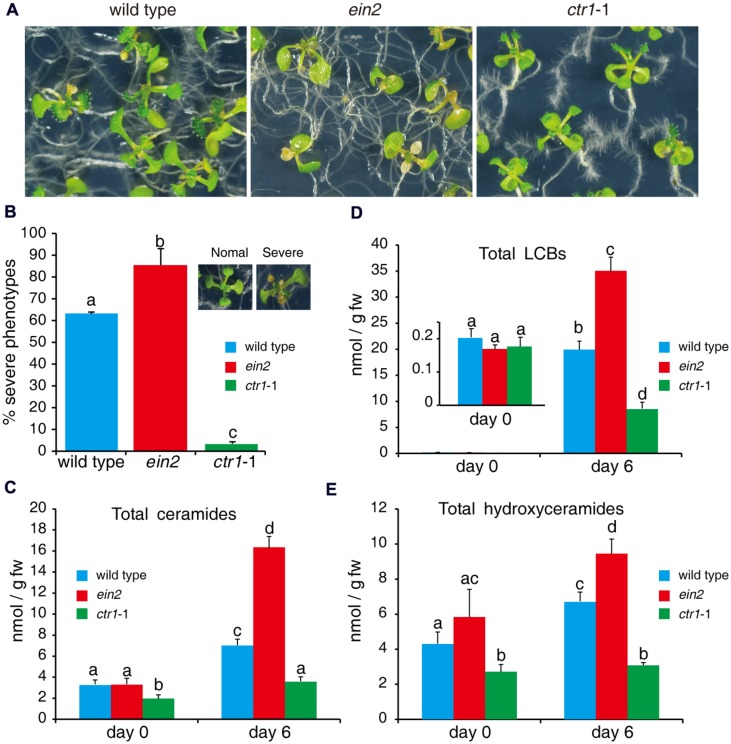
FIGURE 5.
Sphingolipid profiles of wild-type, ein2, and ctr1-1 seedlings during FB1 treatment. Seven-day-old seedlings were treated with 0.5 μM FB1 and collected after 6 days. Total sphingolipids were extracted and analyzed by LC–MS system. (A) Phenotypes of FB1-treated seedlings. Photos were taken after 6 days of treatment. (B) Quantitation of the phenotypes in (A). Seedlings with lesions were scored as having a severe phenotype. The data represent at least three independent experiments. More than 100 seedlings were counted. (C–E) Comparisons of different kinds of sphingolipids in wild-type, ein2, and ctr1-1 seedlings. Data represent means ± SD from three independent biological experiments and sets marked with different letters indicate significances assessed by Student–Newman–Keul test (P < 0.05). (C) LCBs. (D) Ceramides. (E) Hydroxyceramides. See Supplementary Figure S1 for the detailed analysis.

