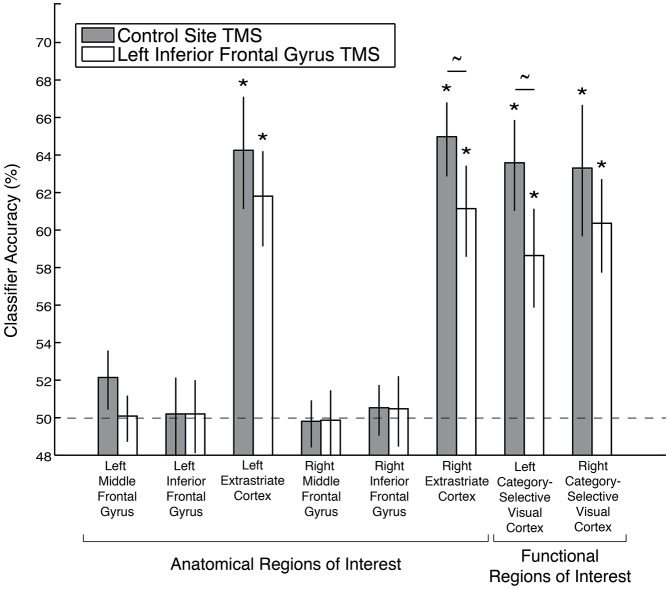
Figure 3.
Decoding accuracy of the stimulus category code following left IFG TMS, as compared to control TMS, in anatomical and functional ROIs. Asterisks indicate significance after Bonferroni correction for multiple comparisons, and tildes indicate p < 0.05 without Bonferroni correction. Error bars depict ± standard error of the mean. Dashed line indicates chance classification accuracy.

