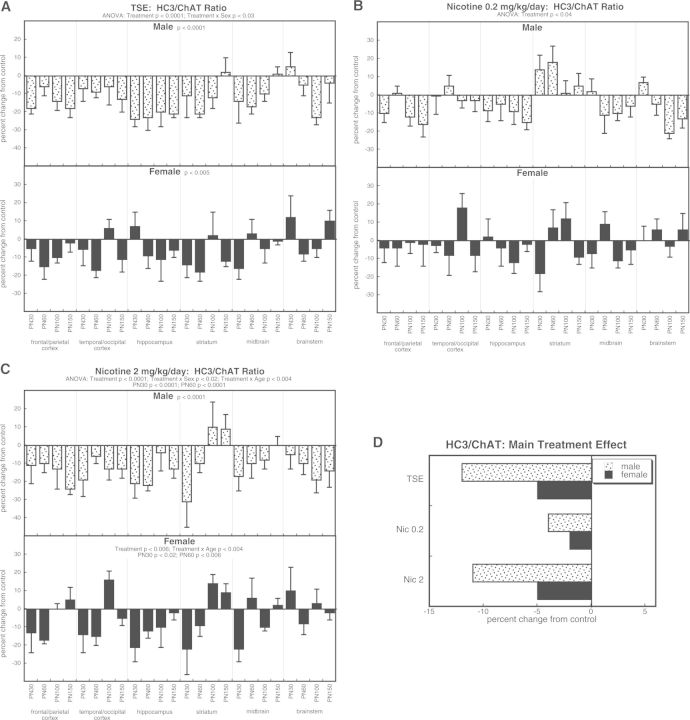
FIG. 3.
Effects of TSE (A), nicotine 0.2 mg/kg/day (B), and nicotine 2 mg/kg/day (C) on the HC3/ChAT ratio. Data represent means and standard errors, presented as the percent change from control values; complete original data are shown in Supplementary Table S4. Multivariate ANOVA for each treatment appears at the top of the panels. Lower-order tests for each sex were carried out only where there was a treatment × sex interaction (A, C). Effects at specific ages are shown where justified by interactions with treatment. Panel (D) shows the simple main treatment effects, collapsed across age and region.

