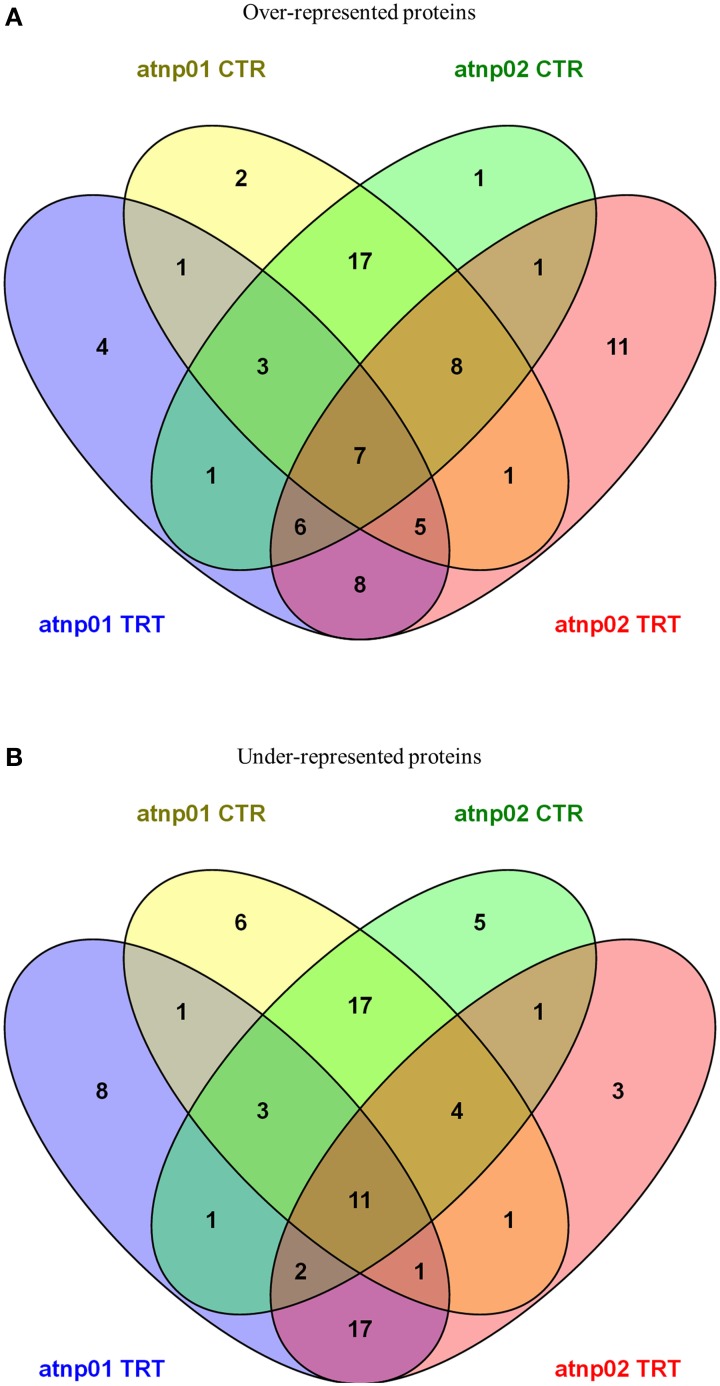
Figure 2.
Venn diagrams for over-represented proteins in atnp01 and atnp02 mutant lines both for control and treatment conditions (A) and under-represented proteins in atnp01 and atnp02 mutant lines both for control and treatment conditions (B). Within each subset a natural figure (n ∈ N) denotes the number of members (proteins) included in the subset.

