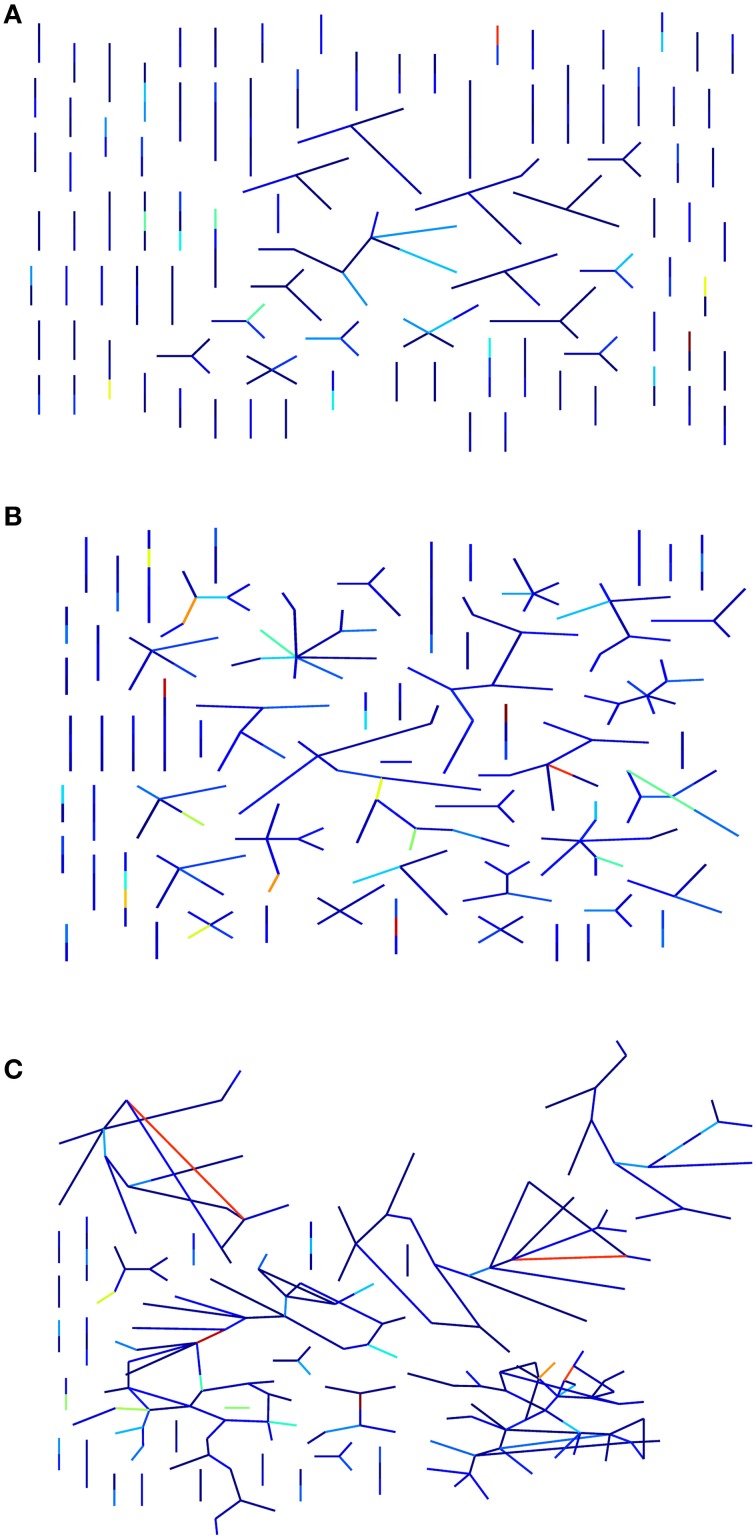
Figure 3.
Estimation of the information compression capability of a graph. In the pictures, a graph layout that prefers edge visualization is adopted. In the final stage, the algorithm that estimates the CF, takes into consideration the random walks for each activation level (i.e., the number of randomly selected activated peripheral nodes). If there are many and small connected components then there are few convergent walks and so a poor compression capacity. (A) A network with a relatively small CF value is supported by the high number of connected component of the graph. Vice versa a newtwork with large CF has many less connected components (C). (B) An intermediate case. Edge colors represent the edge betweenness centrality intensity.

