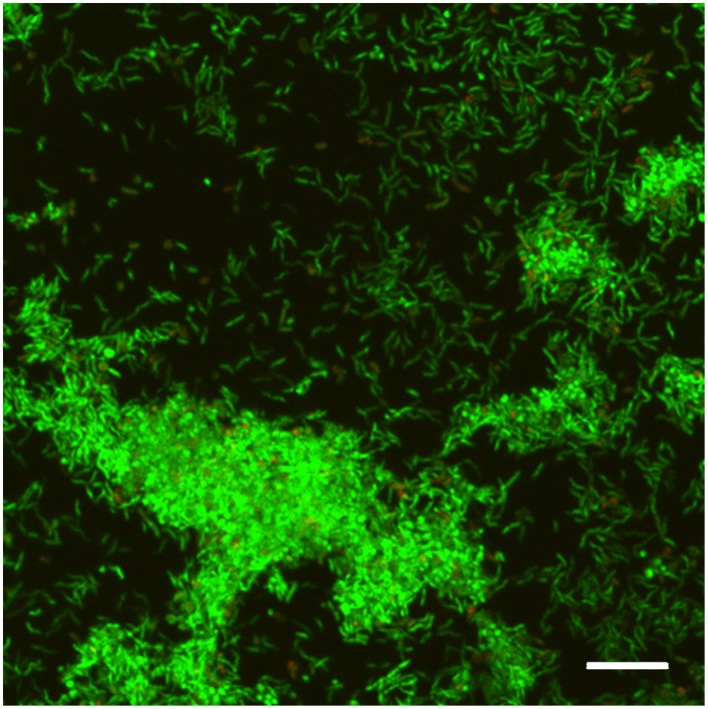
Figure 1.
CLSM representative image of biofilm obtained from H. pylori ATCC 43629/NCTC 11639 samples stained with SYTO 9 (viable cells, green fluorescence) and Propidium Iodide (dead cells, red fluorescence) after 48 h of incubation. Scale bar = 5 μm. A representative image of five different experiments.

