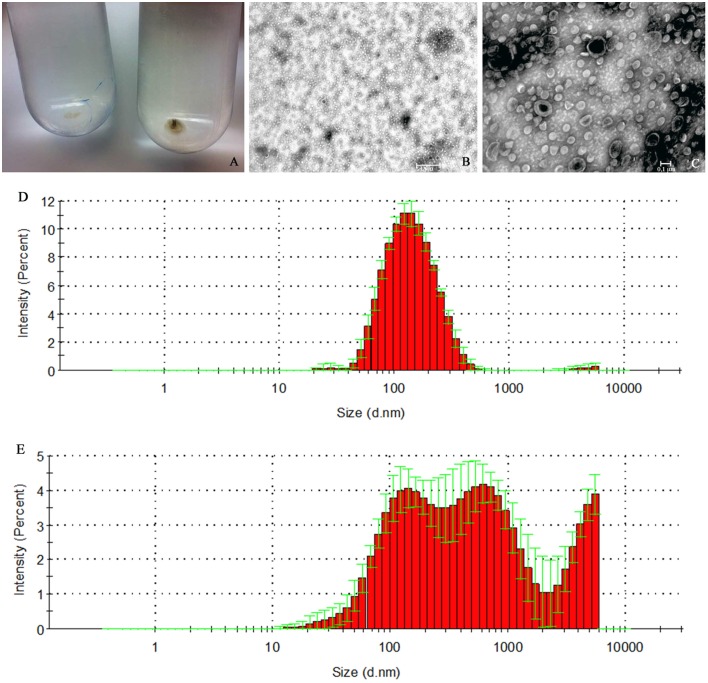
Figure 2.
H. pylori ATCC 43629/NCTC 11639 pOMVs and bOMVs isolation. (A) OMVs ultra-centrifuged pellets from H. pylori planktonic and biofilm phases. The bOMVs pellets (left) were smaller than the pOMVs (right) and were white in color while the pOMVs pellets were dark yellow. (B,C) Negative staining of vesicles generated by H. pylori. DLS histogram analysis of pOMVs and bOMVs are shown in panels (D,E) respectively. (E) bOMVs had a more heterogeneous bimodal distribution of nanovesicles. In fact, there are three peaks, the first one at 681.1 nm (S.D. ± 256.2), the second one at 1760 nm (S.D. ± 2216) and the third one at 2557 nm. Figures are representative of five measurements.

