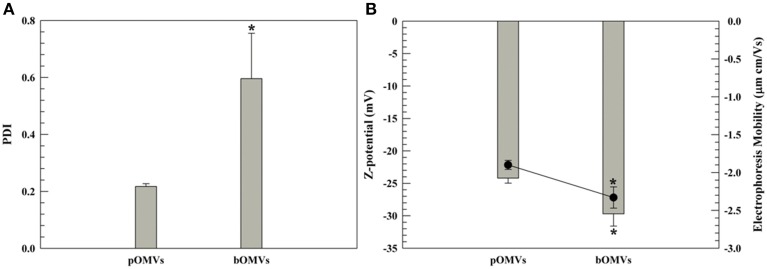
Figure 3.
DLS panel (PDI and Z-potential). PDI (A) and Z-potential (B) of pOMVs and bOMVs. (B), the histograms represent the Z-potential values (mV); while the black full circles are the electrophoretic mobility [(μm × cm)/Vs]. The sample analysis was carried out at 25°C and data are the average of 10 measurements ± standard deviation as triplicates. The error bar if not visible is within the symbol. *p ≤ 0.05.

