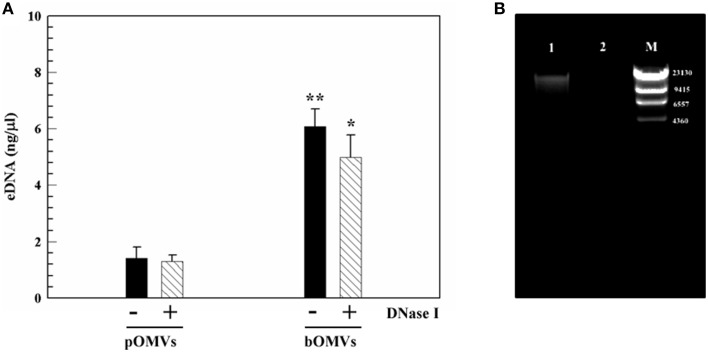
Figure 6.
eDNA associated with OMVs. (A) Detection and quantification of eDNA-pOMVs and eDNA-bOMVs associated, DNase I treated and untreated, by using PicoGreen assay. **p ≤ 0.003; *p ≤ 0.010 for differences of bOMVs compared to pOMVs. The protein content was used to normalize eDNA. (B) Representative image of agarose gel analysis of bOMVs-DNA from H. pylori ATCC 43629/NCTC 11639, untreated (lane 1), and DNase I-treated (lane 2). The lambda DNA/HindIII marker (M), DNA fragments are in base pairs.

