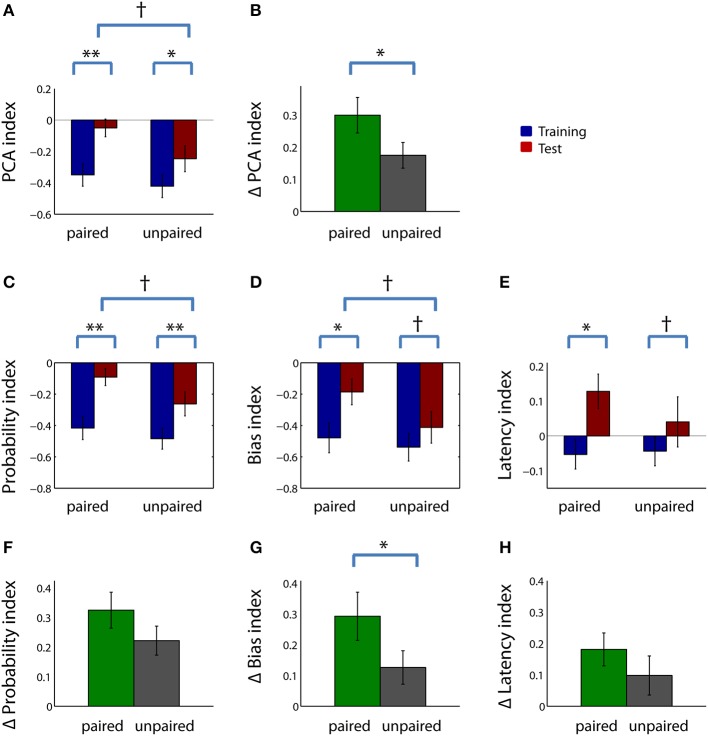
Figure 3.
Sign-tracking behavior is increased, not decreased, relative to goal-tracking behavior in rats that have undergone reward devaluation. (A) Mean PCA index during the last 4 days of training (left) and in the test session (right) for the paired group (blue) and unpaired group (red). (B) Mean change in PCA index from training to test session for the paired group (green) and unpaired group (gray). (C–E) Mean probability index (C), bias index (D), and latency index (E) for the paired group (left) and unpaired group (right) during the last 4 days of training (blue) and during the test session (red). (F–H) Mean change in probability index (F), bias index (G), and latency index (H) from training to test session for the paired group (green) and unpaired group (gray). See Materials and Methods for details of index calculation. All panels: error bars, ±SEM; double asterisks, corrected p < 0.001; single asterisk, corrected p < 0.05; dagger, corrected or uncorrected p < 0.1. All unlabeled comparisons are non-significant (uncorrected p > 0.1).

