
Figure 1.
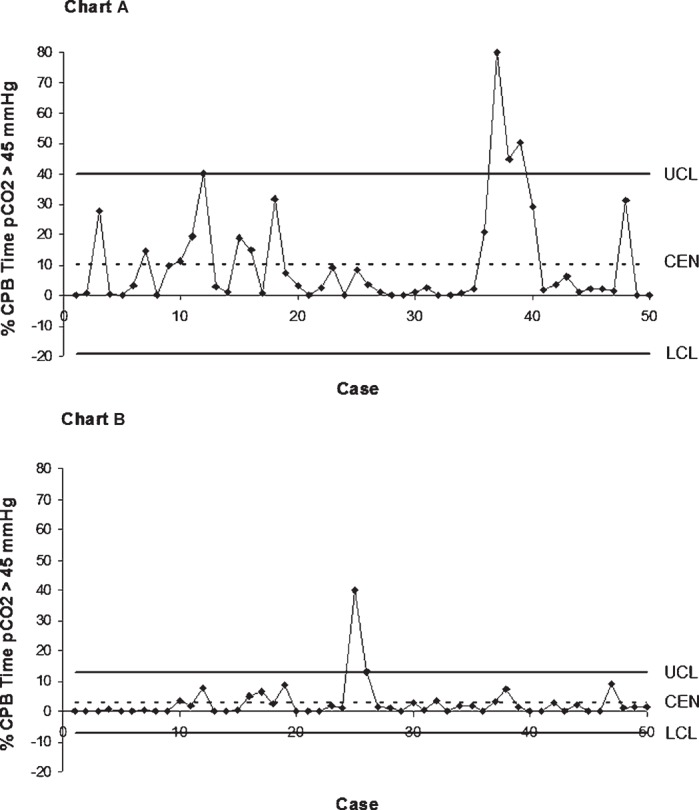
Percentage of CPB time pCO2 is >45 mmHg for each case in the Control (Chart A; n = 50) and CDI group (Chart B; n = 50). The pCO2 values were based on the CDI™500 in-line blood gas monitor. The upper (UCL) and the lower (LCL) control limit, and the central line of tendency (CEN) are also shown for each group.