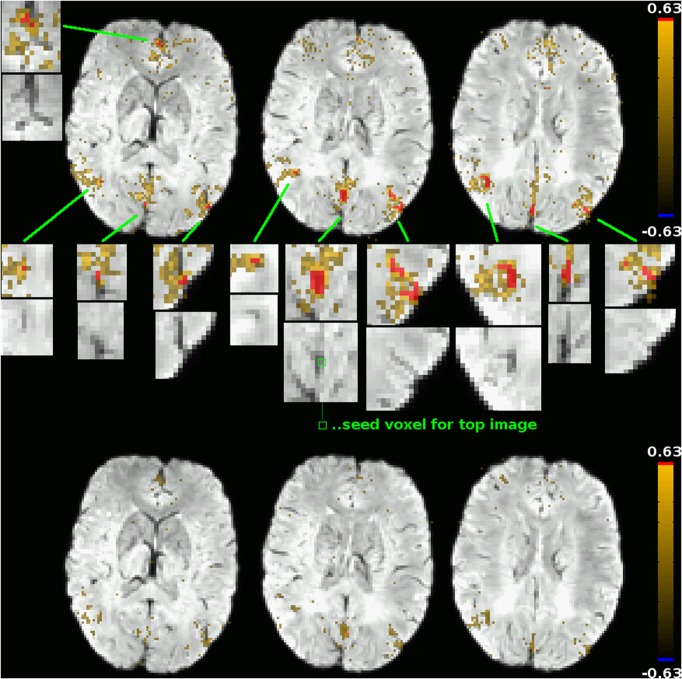
Figure 5.
Functional connectivity maps for two adjacent voxels in the PCC: one within a vein as identified by SWI (top subfigure; seed location marked out in the central zoomed insert), one outside of large veins (bottom subfigure; seed location identifiable as a red dot in the connectivity map). The underlay is the subject's SWI, coregistered to EPI space. Voxels exceeding that subject's correlation threshold for graph binarization (0.63) are marked out in red, maps are thresholded at a correlation coefficient of 0.25. Only for the venous seed do correlations exceeding this threshold exist; they are shown in zoomed inserts, along with the corresponding picture detail from the underlay alone. All voxels with a correlation coefficient exceeding the binarization threshold can be attributed to veins identifiable in the underlay. Correlations to other voxels of the default-mode network, including non-venous voxels, can be seen for both seeds, but correlation strengths in these voxels do not exceed the binarization threshold.

