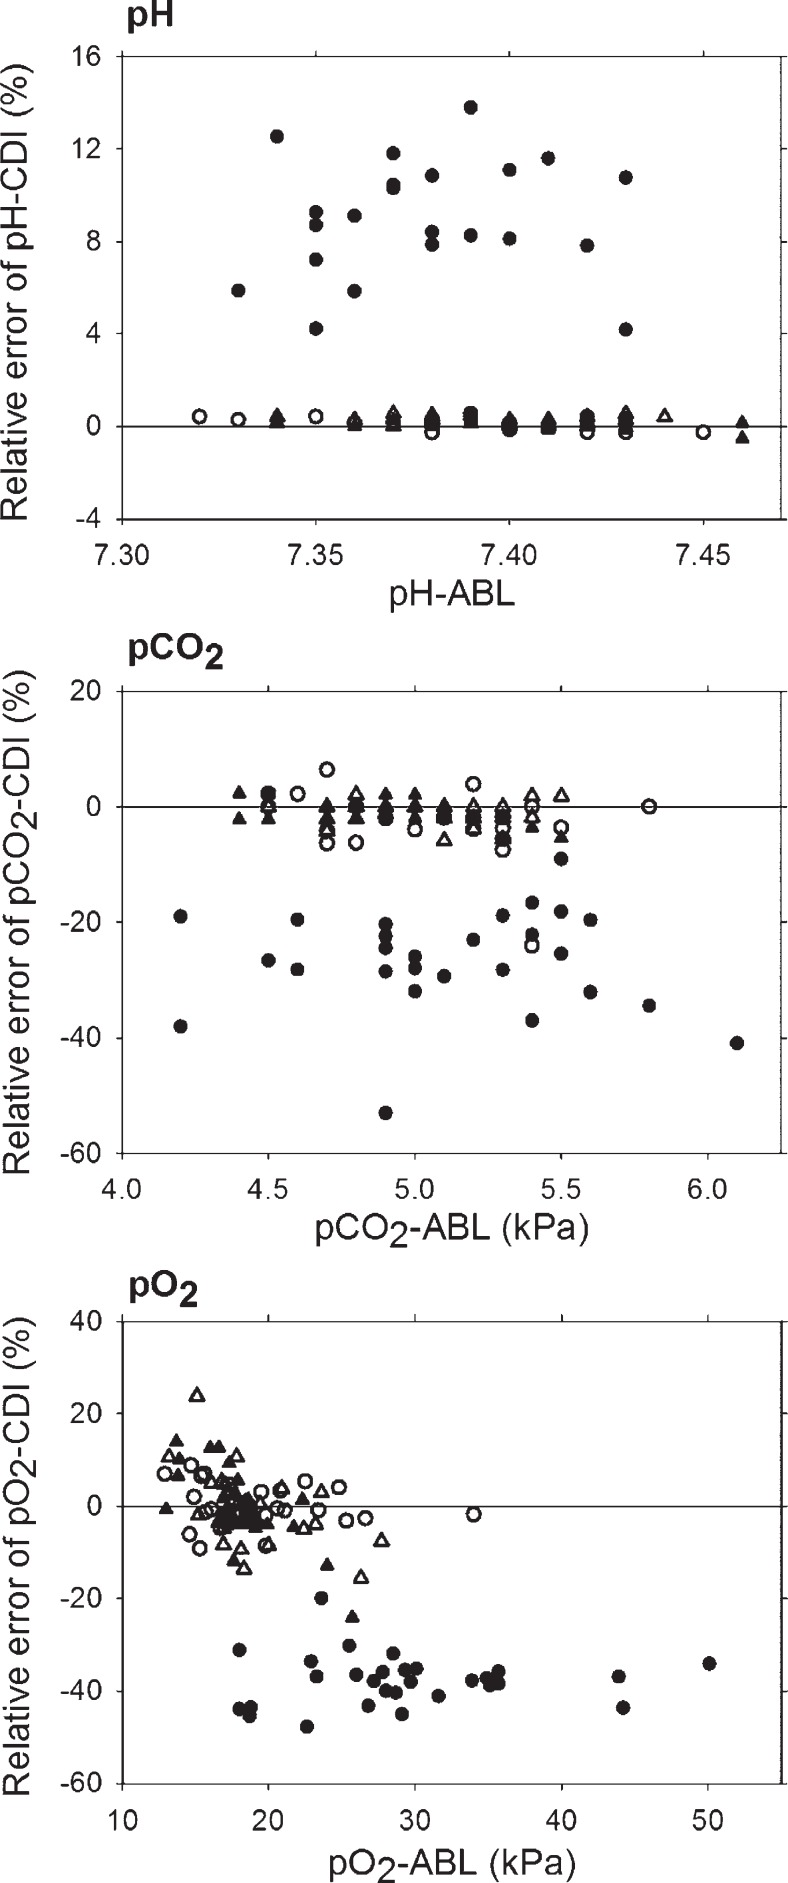
Figure 1.
Bland-Altman plots for the agreement between the CDI and ABL methods for pH (top), pCO2 (center), and pO2 (bottom); with gas calibration, before in vivo calibration (○), with gas calibration, after in vivo calibration (△), without gas calibration, before in vivo calibration (●), without gas calibration, after in vivo calibration (▴). The relative errors of each CDI estimate are plotted against the reference ABL measurements The solid line in each plot represents zero relative error of CDI estimates compared to ABL measurements.

