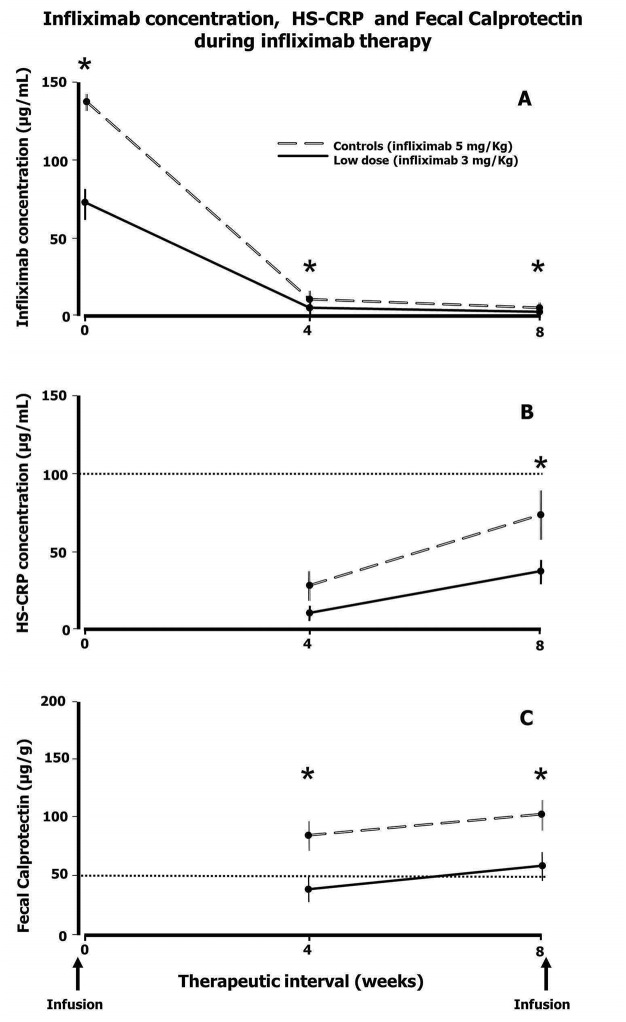
Fig 2. Infliximab concentration (A), Highly Sensitive [HS]–CRP (B) and Fecal Calprotectin (C) during infliximab therapy.
Empty long dash lines: control patients (treated with infliximab 5 mg/Kg); Filled lines: study subjects (treated with infliximab 3 mg/Kg). Square dot lines indicate the upper limit of the normal range for HS-CRP and Fecal Calprotectin. Values are reported as mean and standard error (vertical bars). The asterisk denotes a significant difference (p < 0.05) between controls and study subjects at a given time point during the 8-week therapeutic interval.

