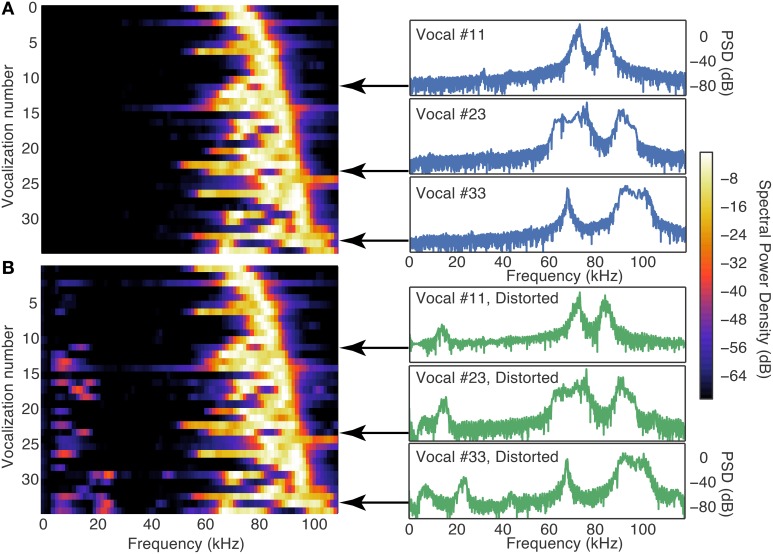
Figure 4.
The cochlea distortion filter introduced low frequency energy into the vocalization signals. (A) Contour plot of the power spectral densities of all 35 vocalizations lined up in order of the frequency of their peak power (left column) and three example vocalizations with high resolution. (B) Same as (A), but for the cochlear distortion model applied to the vocalizations. The color scale shows the spectral power relative to the maximum SPL of the stimulus (65 SPL).

