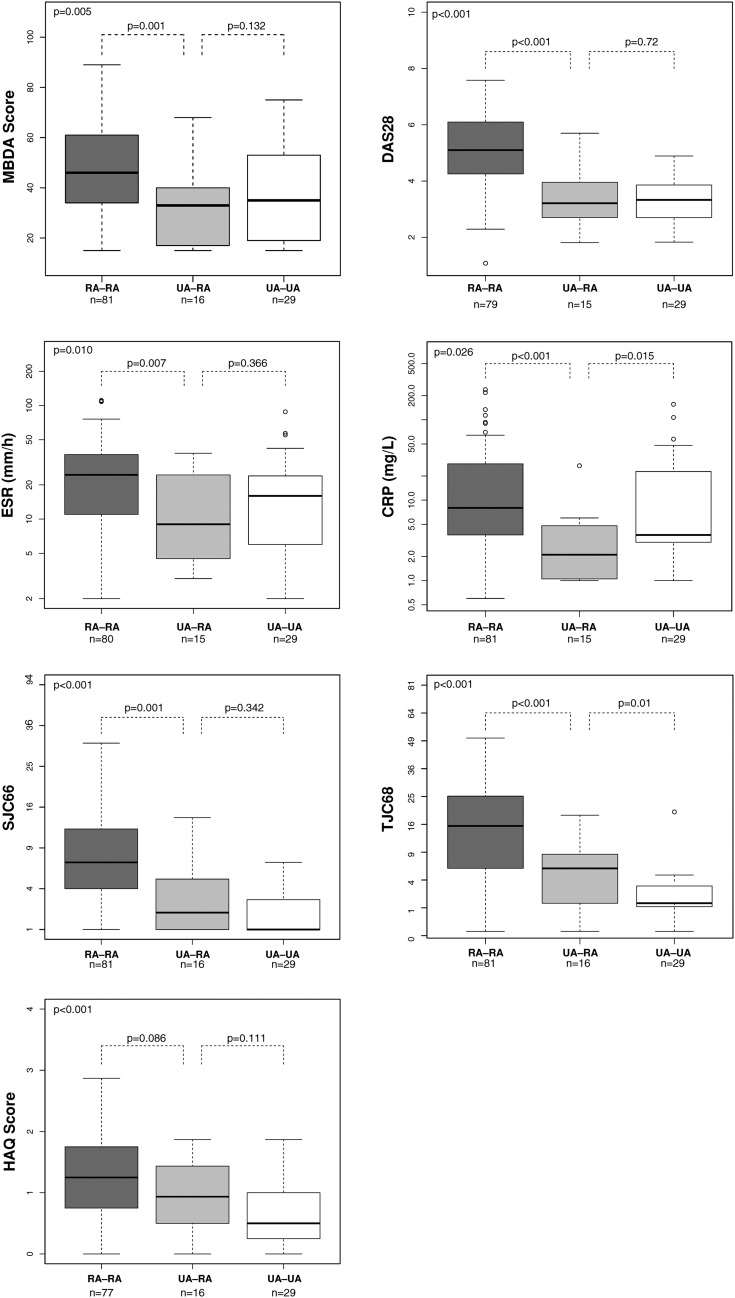
Figure 1.
Comparison of baseline disease activity measures across the diagnosis groups. Disease activity measures are shown for patients grouped according to their diagnosis at baseline and at 2 years. Thick horizontal line: median; box: IQR; whiskers: most extreme points within 1.5× IQR. p Values were derived by Wilcoxon's test. p values in the upper left corners represent the significance of the trends across the three groups by Jonckheere-Terpstra test. CRP, C reactive protein; DAS28, disease activity score based on 28 joints (based on ESR); ESR, erythrocyte sedimentation rate; HAQ, Health Assessment Questionnaire; MBDA, multi-biomarker disease activity; RA, rheumatoid arthritis; SJC66, 66 swollen joint count; TJC68, 68 tender joint count; UA, unclassified arthritis.

