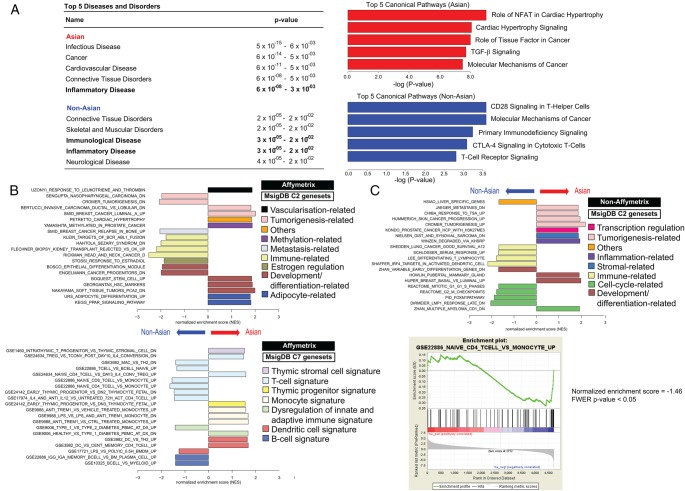
Figure 3.
Pathway analyses of Asian versus non-Asian gastric cancer (GC) profiles. Panel (A) illustrates Ingenuity Pathway Analysis (IPA) results; ‘inflammatory disease’ is among the top five diseases and disorders most commonly associated with both Asian and non-Asian GCs. However, non-Asian GCs are also enriched for ‘immunological disease’. For signalling pathways, T-cell-related canonical signalling pathways (eg, ‘CD28 Signalling in T-Helper Cells’, ‘CTLA-4 Signalling in Cytotoxic T-Cells’, ‘T-Cell Receptor Signalling’) feature prominently in the top five significant canonical pathways (Fisher's test p<0.05) in non-Asian tumours. Panel (B) shows results from GeneSet Enrichment Analysis (GSEA) for Affymetrix-based arrays. Interrogating MSigDB C2 (curated) genesets revealed multiple immune signatures (pale yellow bars; top diagram) among the top ten enriched genesets associated with non-Asian GCs, while such signatures are absent among Asian samples. Additionally, interrogating MSigDB C7 (immunological) genesets showed that the immune signatures observed in non-Asian GCs are enriched for T-cell-related signatures (light blue bars; bottom diagram) compared with Asian GCs. Panel (C) top diagram depicts GSEA results for non-Affymetrix-based arrays, when interrogated against C2 genesets. In general, immune signatures (pale yellow bars) are also enriched among the top ten genesets associated with non-Affymetrix non-Asian GCs. The top portion of the bottom diagram shows the running enrichment score (ES) for the T-cell-related pathway ‘GSE22886_NAIVE_CD4_TCELL_VS_MONOCYTE_UP’. The ES for the pathway is defined as the peak score furthest from zero. In this case, ES is significantly negative (normalised ES=−1.46; Familywise error rate (FWER) p value <0.05) that is, enriched in non-Asian GCs in the non-Affymetrix-based studies. This is shown in the middle portion of the plot (black vertical lines; ie, members of the geneset in order of appearance in the ranked list of genes) where most of the gene members appear after the peak score.

