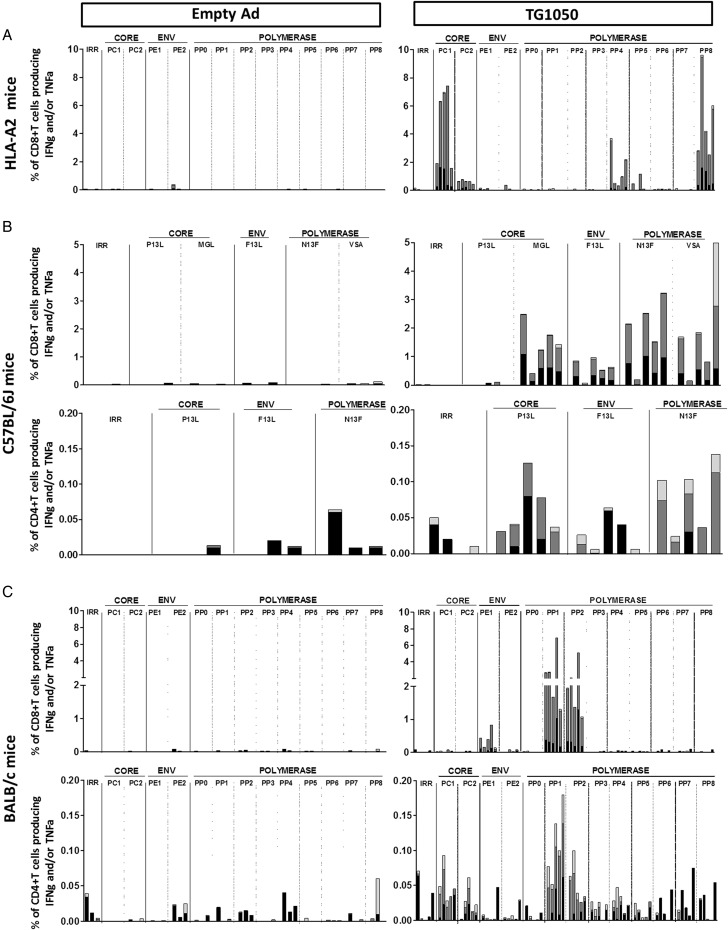
Figure 2.
Analysis of induced T cell responses following single injection of TG1050 using interferon γ (IFNγ)/tumour necrosis factor α (TNFα) ICS assay in (A) HLA-A2 transgenic mice, (B) C57BL/6J mice and (C) BALB/c mice. HLA-A2 transgenic mice or C57BL/6J or BALB/c mice were immunised once subcutaneously with TG1050 or an empty Adenovirus (negative control) and HBV-specific immune responses were monitored on spleen cells using IFNγ/TNFα intracellular cytokine staining assays using single peptides or pools of peptides derived from Core, Env or Polymerase HBV proteins for stimulation. The results are presented as the percentage of IFNγ and/or TNFα producing CD8+ or CD4+ T cells for each group. Each bar corresponds to an individual mouse. For each mouse, the white bar represents the percentage of CD8+ or CD4+ T cells producing TNFα alone, the grey bar represents the percentage of CD8+ or CD4+ T cells producing IFNγ and TNFα and the black bar represents the percentage of CD8+ or CD4+ T cells producing IFNγ alone.

