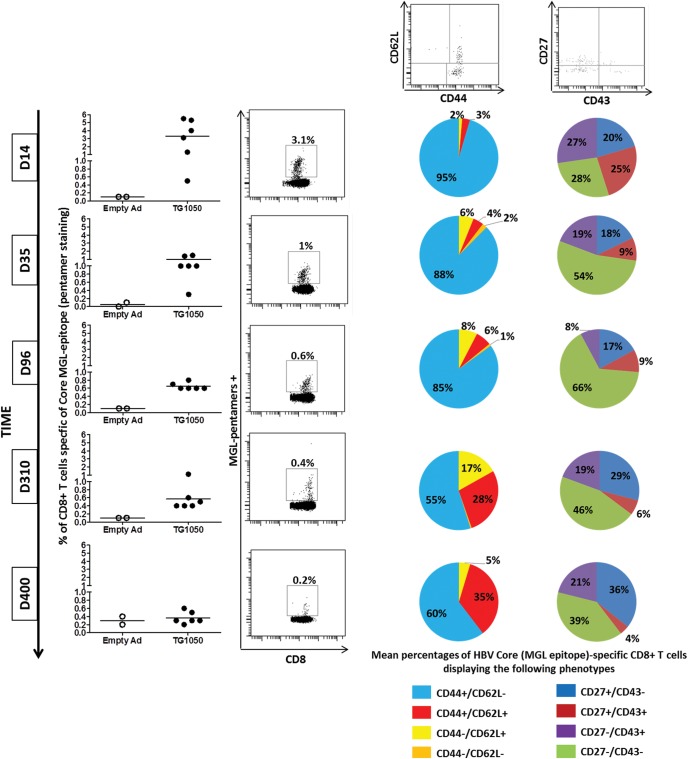
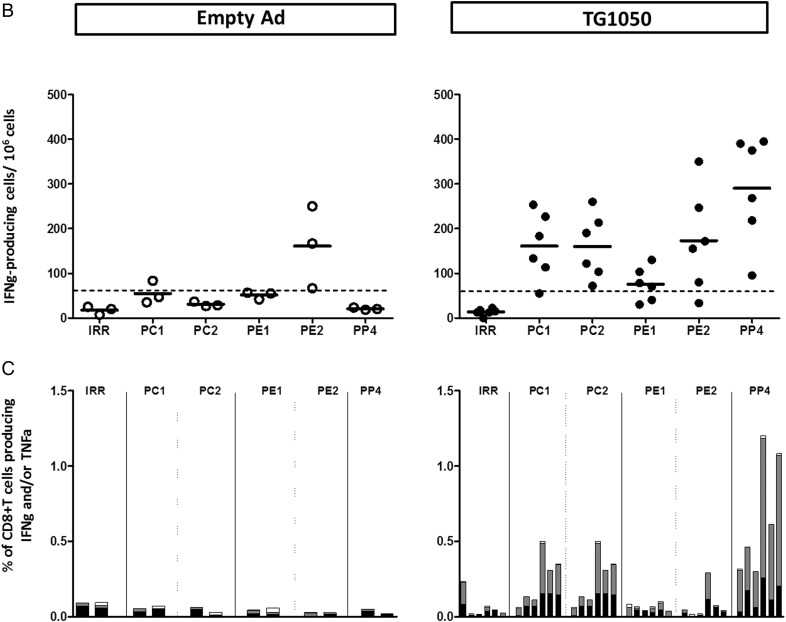
Figure 3.
Analysis of long-term HBV-specific T cells following a single injection of TG1050 up to 400 days post-injection. C57BL/6J mice were immunised once subcutaneously with TG1050 or an empty Ad (negative control). (A) HBV-specific cells were monitored and quantified along time in whole blood of injected mice by pentamer staining of HBV Core-specific T cells. An example of a dot plot obtained for one representative mouse injected with TG1050 at each time point is also shown on the right side of the graphs. Phenotypes of these Core-specific T cells were assessed by following CD44 and CD62L as well as CD27 and CD43 markers. Examples of dot plots obtained for CD62 L/CD44 and CD27/CD43 staining experiments in TG1050-injected mice are also shown at the top of the figure (shown for day 400). Pie charts representative of the mean percentages of HBV Core (MGL epitope)-specific CD8+ T cells displaying the indicated phenotypes are shown. (B, C). Interferon γ (IFNγ) ELISPOT (B) and intracellular cytokine staining (ICS) (C) assays realised at 400 days post-injection were performed using spleen cells and pools of overlapping peptides covering, respectively, the HBV Core protein (PC1, PC2), the 2 Env domains (PE1, PE2) and the HBV polymerase protein (PP4) or irrelevant peptides (IRR). For ELISPOT assay (3B), the horizontal dotted line represents the threshold of ELISPOT positivity. Each individual mouse is represented by an empty (empty Ad injected mice) or a plain (TG1050 injected mice) circle and the black line represents the mean of each group. For IFNγ/tumour necrosis factor α (TNFα) ICS assay (C), the results are presented as the percentage of IFNγ- and/or TNFα-producing CD8+ T cells for each group. For each mouse, the white bar represents the percentage of CD8+ T cells producing TNFα alone, the grey bar represents the percentage of CD8+ T cells producing IFNγ and TNFα and the black bar represents the percentage of CD8+ T cells producing IFNγ alone.


