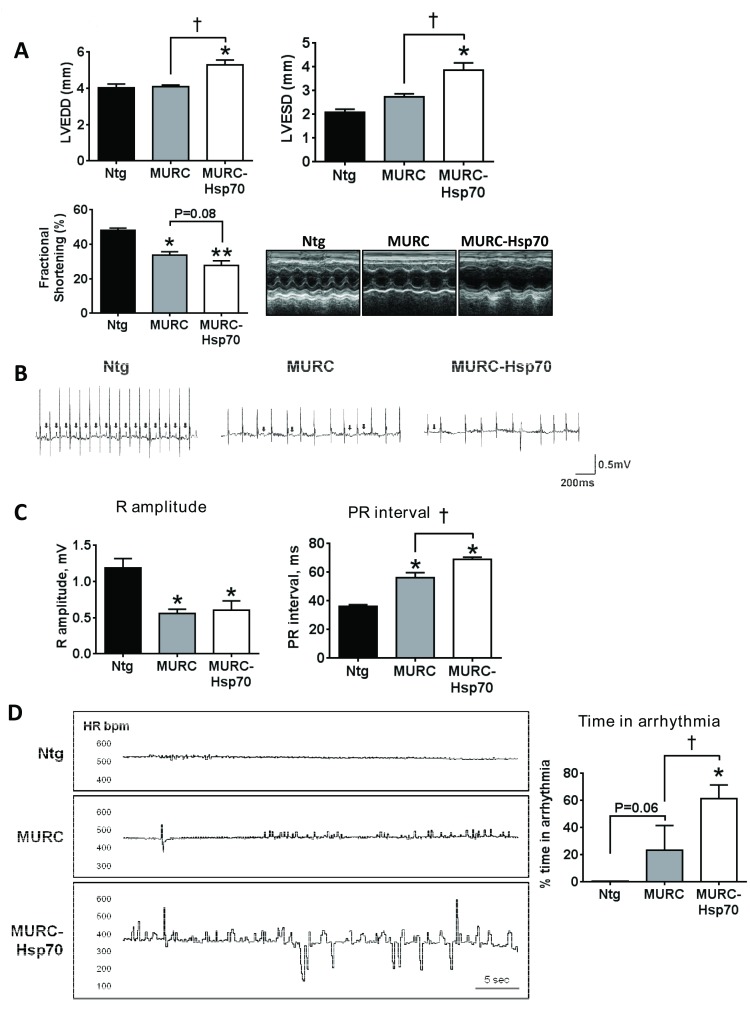
Fig 2. Transgenic overexpression of HSP70 did not attenuate cardiac dysfunction and electrophysiology abnormalities.
(A) Quantification of LVEDD, LVESD and FS in 12 month old Ntg, MURC and MURC-Hsp70 Tg mice. N = 3–5 per group. *P<0.05 vs. Ntg, **P<0.0005 vs. Ntg, †P<0.05. Lower right: Representative M-mode echocardiograms in 12 month old Ntg, MURC and MURC-Hsp70 Tg mice. (B) Representative ECG traces in 12 month old Ntg, MURC and MURC-Hsp70 Tg mice. Arrows highlight clear P-waves. (C) Quantification of R amplitude and PR interval in Ntg, MURC and MURC-Hsp70 Tg mice. N = 3–5 per group. *P<0.05 vs. Ntg, †P≤0.05. (D) Representative heart rate (HR) variability traces and quantification of time in arrhythmia in 12 month old Ntg, MURC and MURC-Hsp70 Tg mice. N = 3–5 per group. *P<0.05 vs. Ntg (One Way ANOVA with Fisher’s posthoc test), †P<0.05, P = 0.06 (Mann-Whitney nonparametric t-test).

