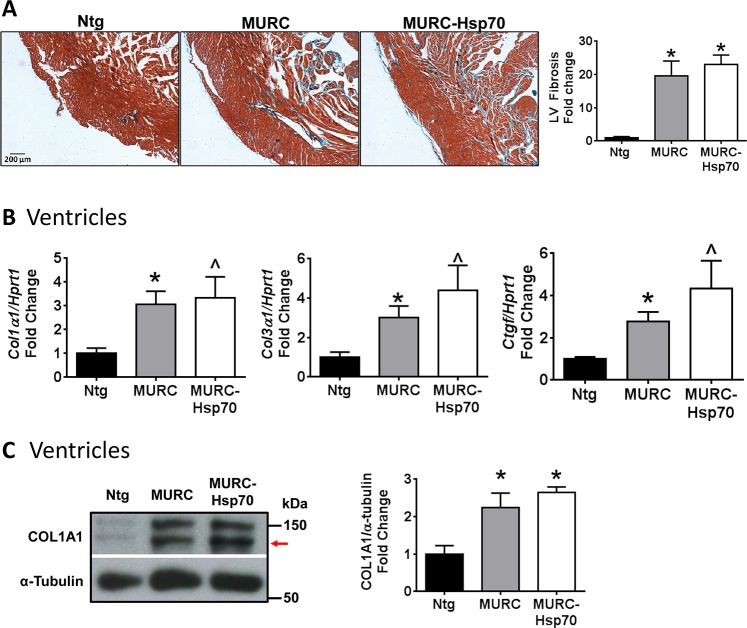
Fig 4. Analysis of cardiac fibrosis and collagen gene expression in MURC and MURC-Hsp70 Tg mouse models.
(A) Representative LV cross-sections stained with Masson’s trichrome and quantification of LV fibrosis in Ntg, MURC and MURC-Hsp70 Tg mice. Scale = 200 μM. N = 3–5 per group. *P<0.05 vs. Ntg. (B) qPCR analysis of Collagen 1 (Col1α1), Collagen 3 (Col3a1) and Connective tissue growth factor (Ctgf) relative to Hprt1. N = 3–5 per group. *P<0.05 vs. Ntg (unpaired t-test), ^P<0.05 vs. Ntg (Mann Whitney nonparametric test). (C) Representative Western blots and quantification of collagen 1 (Col1α1) in ventricles of Ntg, MURC and MURC-Hsp70 Tg mice. Arrow indicates band quantified. N = 3–5 per group. *P<0.05 vs. Ntg.

