
Figure 4.
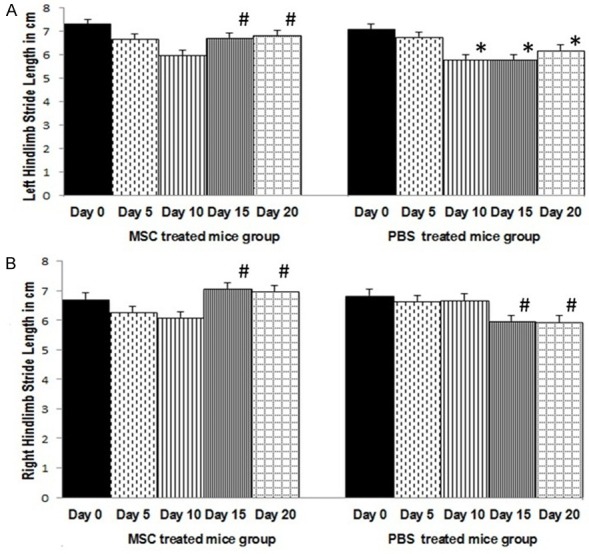
Mean left hindlimb stride length in cm (± S.E) (A) and mean right hindlimb stride length in cm (± S.E) (B) in PBS treated and MSC treated EAE mice groups. In PBS treated EAE mice group (n = 8), significant reduction in hindlimb stride length on day 10 onwards (*P < 0.05) (left) and day 15 onwards (#P < 0.05) (right), compared to pre-experiment day 0. In MSC treated EAE mice group (n = 8), significant increase in left and right hindlimb stride length on day 15 onwards (#P < 0.05) compared to day 10 stride length. MSC treatment was given on day 11. One way repeated measures ANOVA with post hoc Bonferroni.