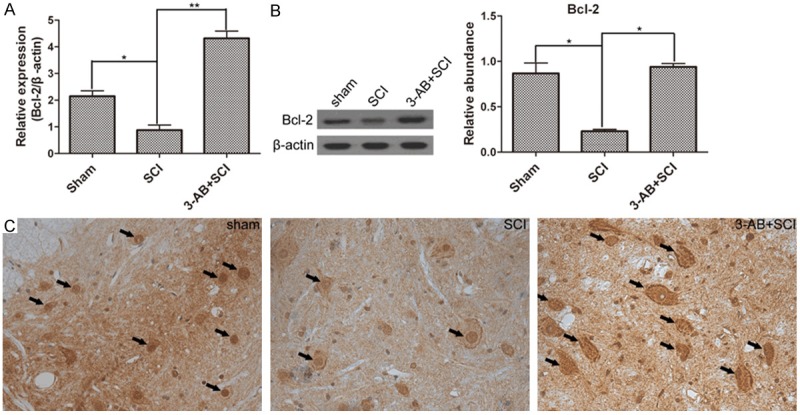
Figure 5.

The expression of Bcl-2. Especially, the Bcl-2 expression was decreased by SCI, but significantly increased by 3-AB treatment in mRNA level (A) and protein level (B); (C) IHC results demonstrated much more deposition of Bcl-2 in 3-AB + SCI. Each column represents mean ± SD; n = 3 per group; *P < 0.05 and **P < 0.01; arrows: AIF deposition.
