
Figure 2.
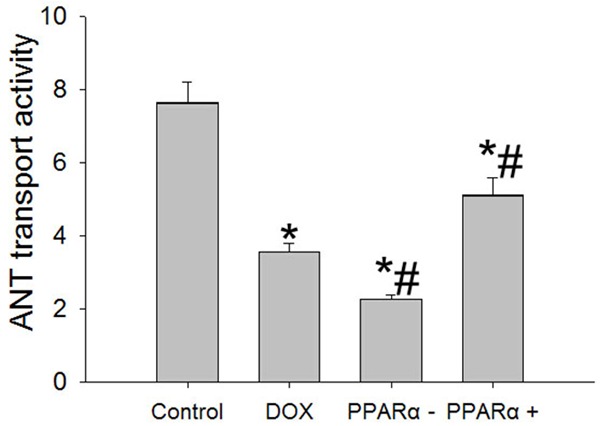
Changes of mitochondrial ANT transport activity in different groups. Data are the mean ± SEM (n=3), each bar represents the mean of three independent experiments carried out in triplicate. *Compared with control group, P<0.05; #Compared with DOX group, P<0.05.