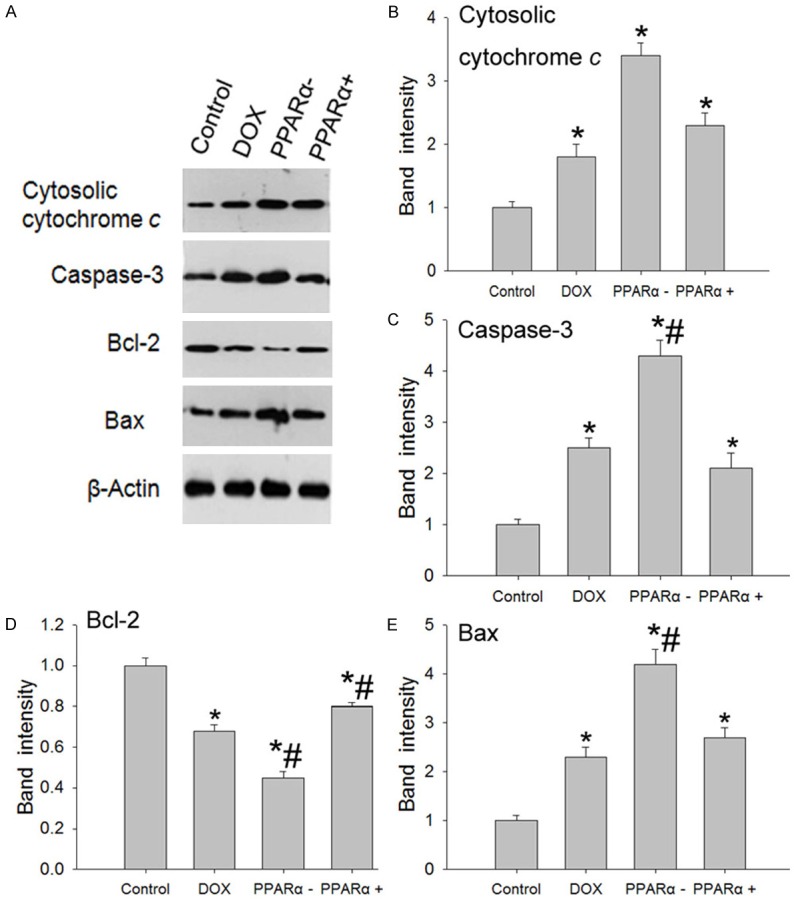
Figure 5.

Expression level of markers for apoptosis in different groups. A. Western blotting results of markers for apoptosis expression indifferent groups. B-E. The graph represents a quantitative measure of band intensities of cytosolic cytochrome c, caspase-3, Bcl-2 and Bax, normalizing to β-actin in each lane. Data are the mean ± SEM (n=3), each bar represents the mean of three independent experiments carried out in triplicate. *Compared with control group, P<0.05, #compared with DOX group, P<0.05.
