
Figure 6.
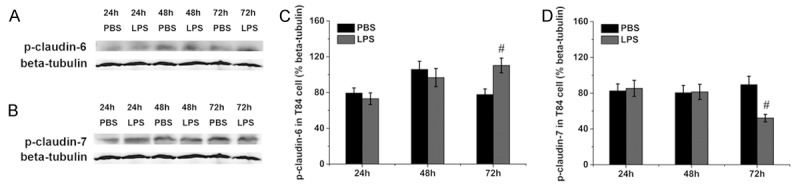
Phosphorylation of claudin-6 and claudin-7 in T84 cells. Representative immunoblots of phosphorylated claudin-6 and claudin-7 are shown in (A) and (B), and the protein levels of phosphorylated claudin-6 and claudin-7 are shown in (C) and (D). Six wells were studied in each group. The results are presented as the means ± SEM. #P < 0.05 vs. the control group.