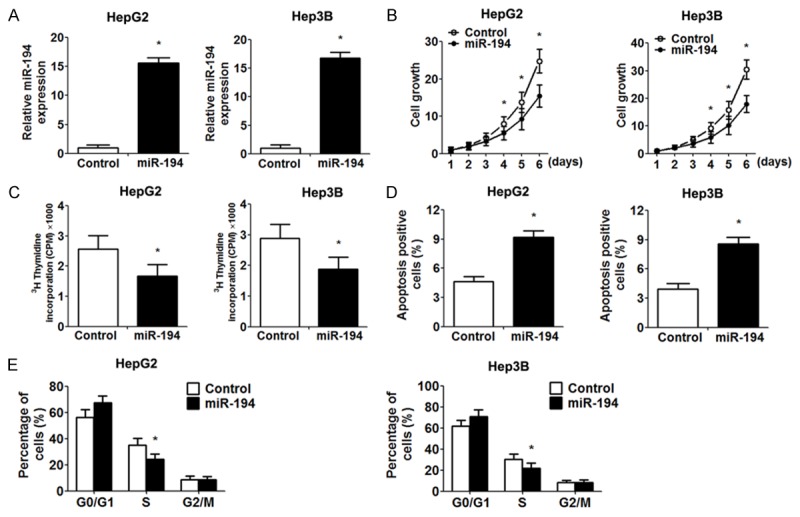
Figure 2.

The impact of miR-194 overexpression on proliferation. A. Validation of miR-194 overexpression in HepG2 and Hep3B cells by RT-PCR analysis. B. MTT assays were performed to examine cells proliferation at the indicated time points. C. The value of 3H thymidine incorporation was measured. D. The percentage of apoptotic cells (Annexin V-FITC positive, PI negative). E. Frequencies of cells at different stages of the cell cycle. Data are expressed as the mean ± SD. *, P<0.05 vs. control group, n = 5.
