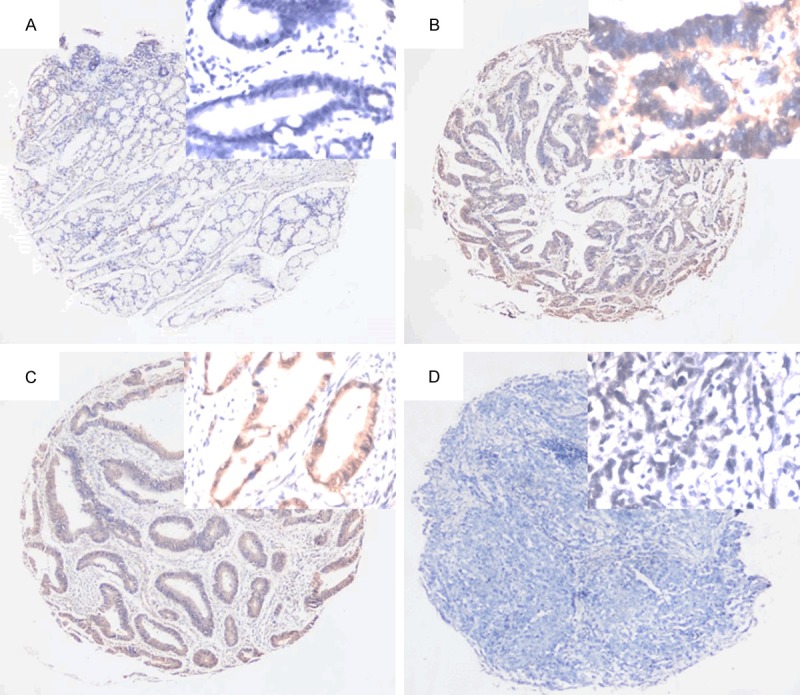
Figure 3.

Expression profiles of PPA1 in gastric cancer. A. Normal tissues with negative staining of PPA1; B, C. Tumor cells with positive staining of PPA1; D. Negative staining of PPA1 in gastric cancers. Original Magnification: large pictures: IHC ×40; small picture: ×400.
