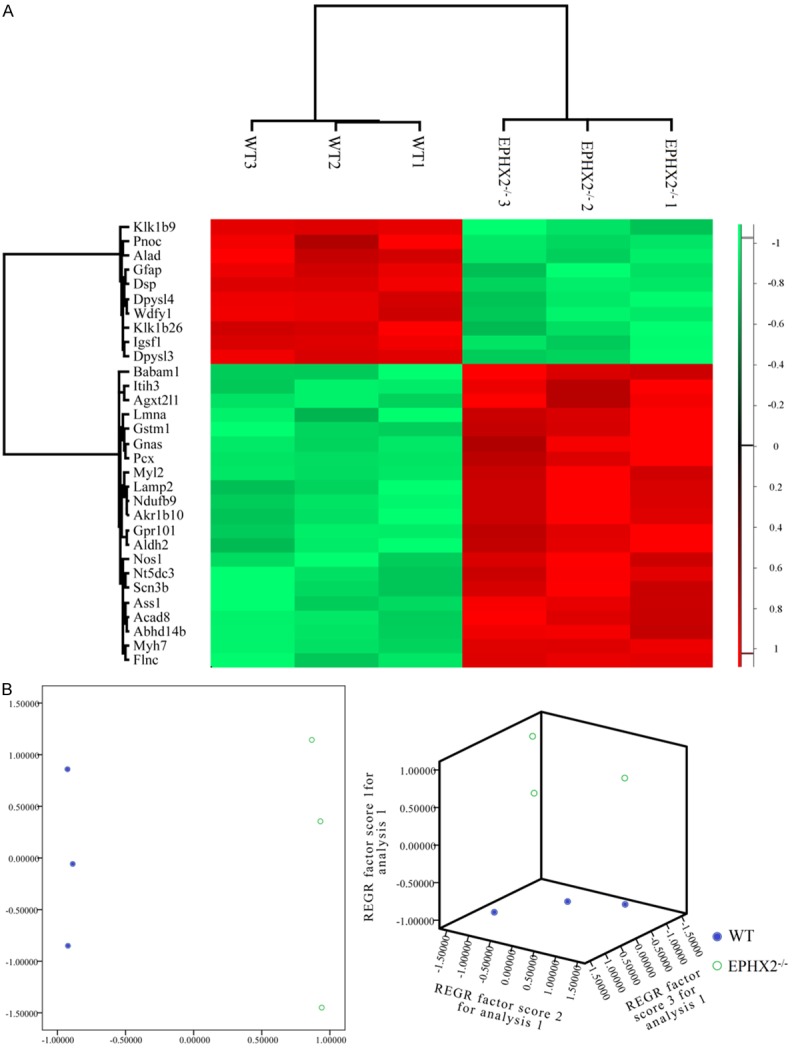
Figure 2.

K-means clustering (A) and principal component analysis (B) of the 31 proteins with different expression in EPHX2 -/- (n = 3) compared with the vehicle groups (n = 3). Color key in the hierarchical clustering represents the different expression levels. Red represents up-regulation, while green represents down-regulated proteins.
