Figure 1.

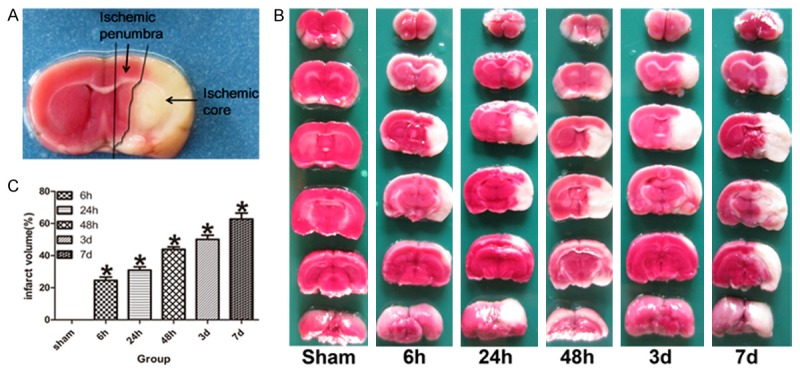
TTC staining showed the infarction and penumbra zone. A. The red zone near the infarction zone represented the ischemic penumbra in the ipsilateral hemisphere of coronal brain section. B. Representative TTC-stained coronal brain sections demonstrate increased infarct size in tMCAO model rats compared with the sham-operated rats. C. The bar graph shows the percent of infarct volume measured by TTC staining in each group (n = 5). Data are expressed as mean ± SD. *P < 0.05 versus sham-operated group.
