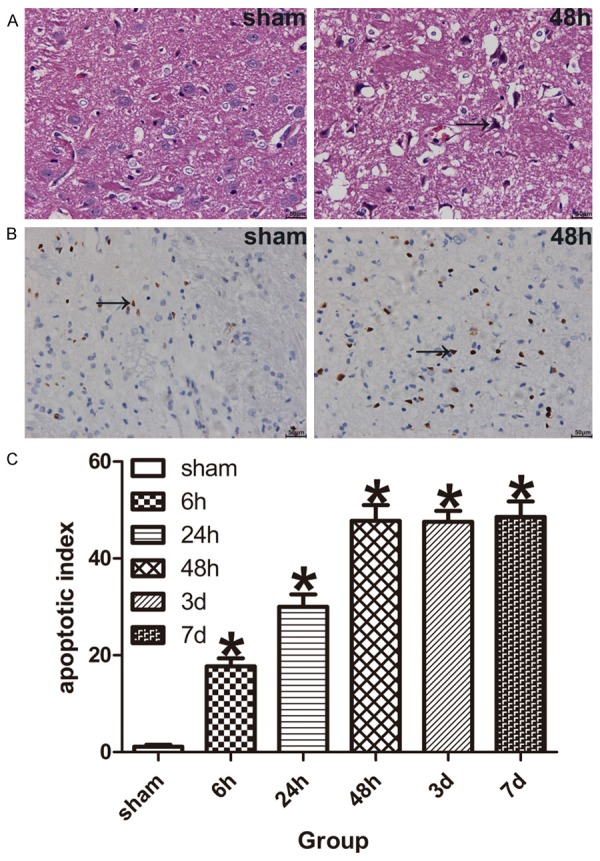
Figure 3.

Neuronal pathomorphology and neuronal apoptosis were assessed by HE and TUNEL Staining. A. HE Staining shows eosinophilic neurons in the ischemic penumbra of tMCAO model rats, black arrow indicate eosinophilic neuron. B. TUNEL Staining shows apoptotic neurons in the ischemic penumbra of tMCAO model rats, black arrow indicate apoptotic neuron. C. The bar graph shows the apoptotic neurons were increased in the ischemic penumbra of model rats (n = 5 for each group). Data are expressed as mean ± SD. *P < 0.05 versus sham-operated group.
