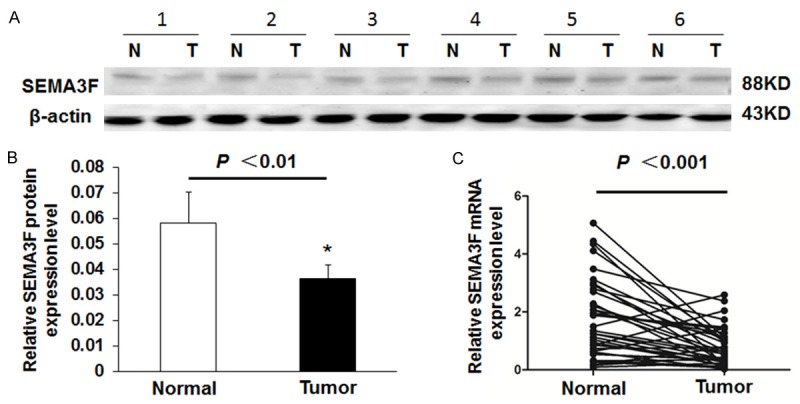
Figure 1.

SEMA3F expression in CRC tissues and adjacent non-tumor tissues. A: Representative result of SEMA3F protein expression in six matched samples of CRC tissues (T) and adjacent non-tumors tissues (N). B: Summary of Western blot results from CRC tissues and adjacent normal tissues presented as relative bands density normalized to the β-actin of the same samples. The average SEMA3F expression level in CRC tissues was significantly lower than that in adjacent non-tumor tissues (n = 24, P < 0.01). C: The average relative expression of mRNA level of SEMA3F in CRC tissues compared to paired adjacent non-tumor tissues (n = 36, P < 0.001).
