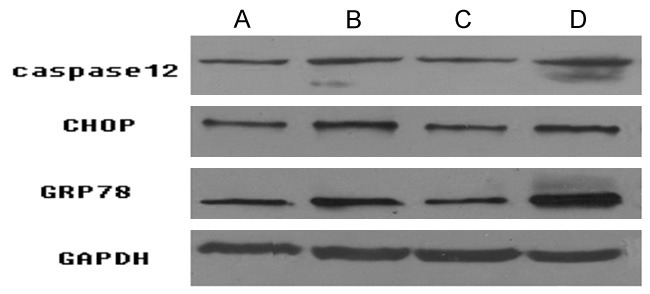
Figure 4.

Protein expression levels of caspase12, CHOP and GRP78 in the control, Aβ25-35 treatment group, Ex-4 pre-protecting group and exendin9-39 pretreatment group. A: The control; B: Aβ25-35 treatment group; C: Ex-4 pre-protecting group; D: Exendin9-39 pretreatment group.
