
Figure 2.
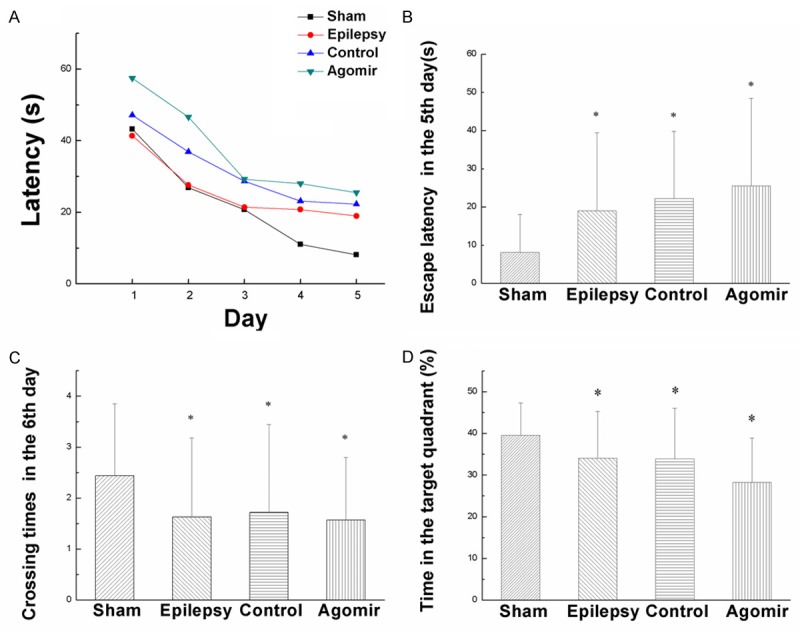
The result of Morris Water Maze test. A. The tendency of escape latency during five days. B. Escape latency of the rats in the 5th day. C. Crossing times of the rats in the 6th day. D. The percentage of time that rats stayed in target quadrant in the 6th day. Values are mean ± SD of 12 rats per group. *P<0.05 compared with the sham group.