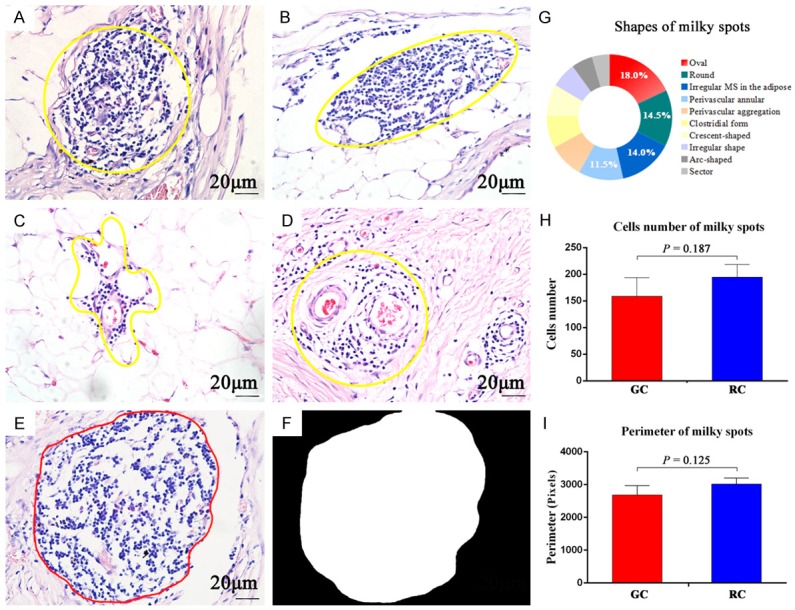
Figure 2.

HE staining of milky spots. The yellow frame is used to show the gross morphology of MS: A. Round. B. Oval. C. Irregular form in adipose tissues. D. Perivascular annular. E→F. Using computer methods to convert HE images into binary images for calculation of MS perimeter. G. Proportions of MS shapes. H + I. Comparison of MS cells number and perimeter between GC and RC, respectively. (A→F: 400×, scale bar =20 μm).
