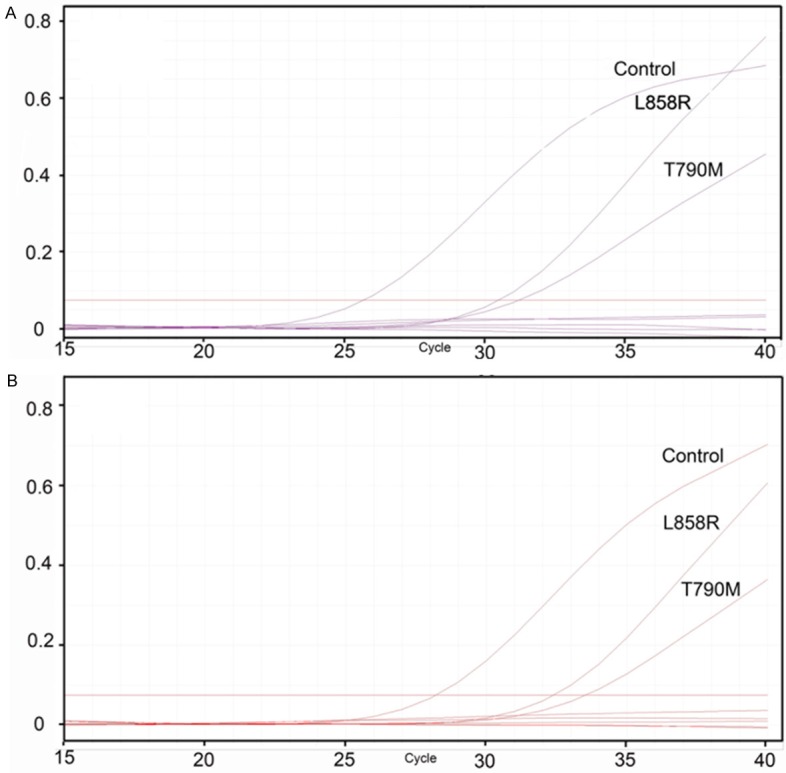
Figure 1.

Amplification plot of EGFR T790M and L858R gene detected in paired plasma (A) and tissue sample (B). The horizontal line represents the threshold. Curves that crossing the threshold and the ΔCt calculated by specific gene control deducting the sample control is less than the confirmed scope (8.58 for L858R in exon 21 of EGFR and 6.38 for T790M) are considered positive for the specific gene. For L858R in exon 21 of EGFR, the sample’s ΔCt is 5.98 in the plasma sample and 4.82 in the corresponding tissue sample. For T790M, the sample’s ΔCt is 5.31 in the plasma sample and 5.53 in the corresponding tissue.
