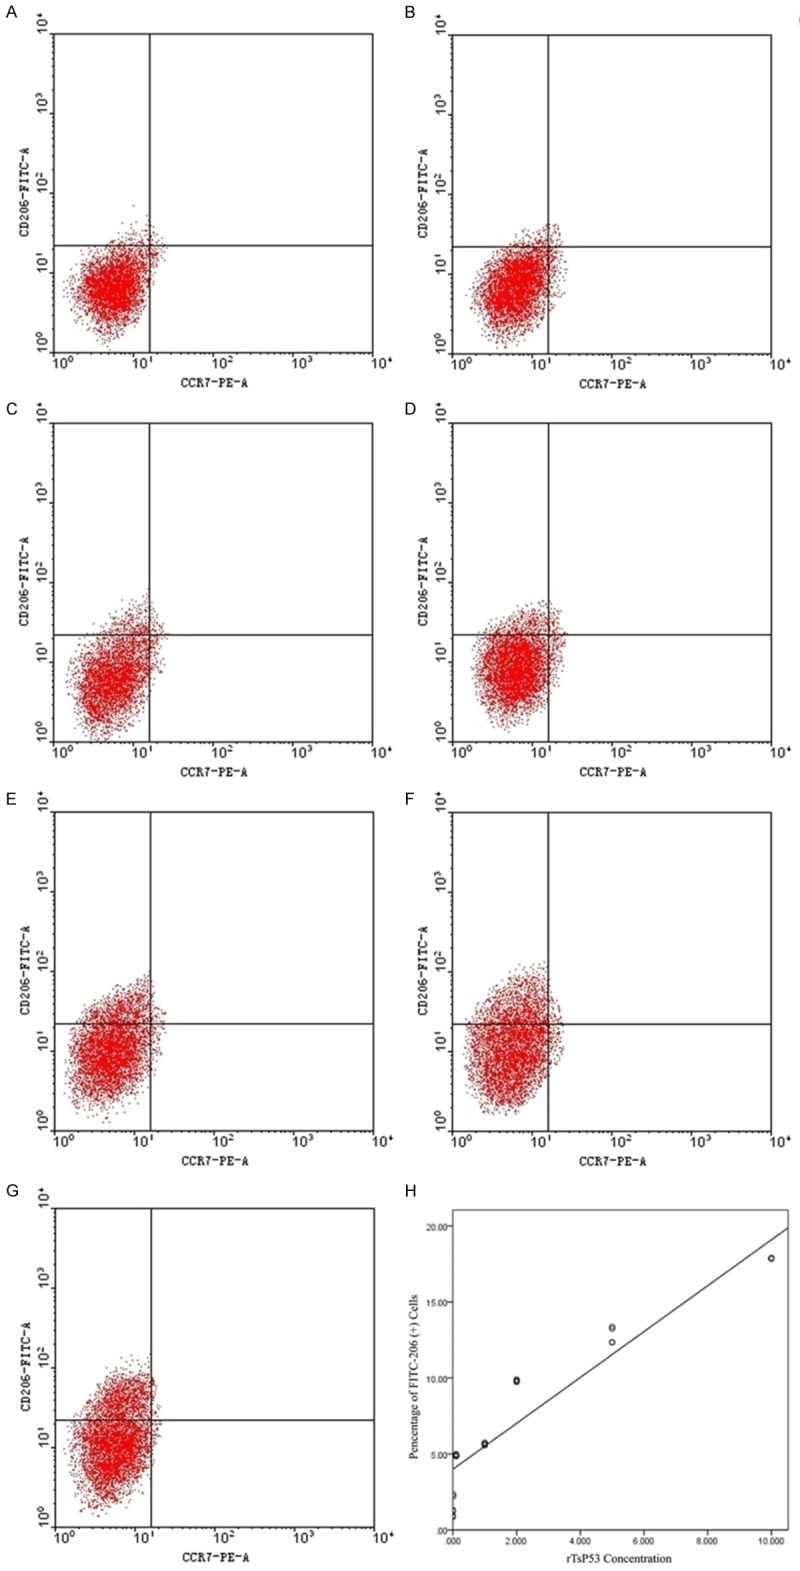
Figure 4.

Flow cytometry of BMDM with Induced Differentiation after 72 h. Flow cytometry of BMDM with induced 0.001 μg/ml (A), 0.01 μg/ml (B), 0.1 μg/ml (C), 1 μg/ml (D), 2 μg/ml (E), 5 μg/ml (F) and 10 μg/ml (G) after 72 h. The ratios of rTsP53 protein and FITC-206 (+) macrophages (H).
