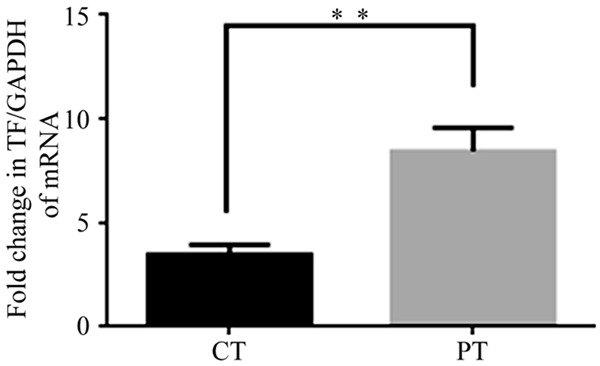
Figure 3.

TF mRNA levels were further assessed by qRT-PCR. Compare to the level of TF mRNA transcription in carcinomatous tissue (CT), it was much higher in peri-carcinomatous tissue (PT), the GAPDH and TF mRNA levels were quantified by absolute qRT-PCR, and the plasmids comprising full-length of each gene were used for quantification of the template. GAPDH was employed as an internal reference. The fold change in TF expression was calculated by the ratio of TF mRNA copy number/GAPDH mRNA copy number. The graph was generated by Graph pad PRISM software (n = 20) (**P < 0.001 vs. other).
