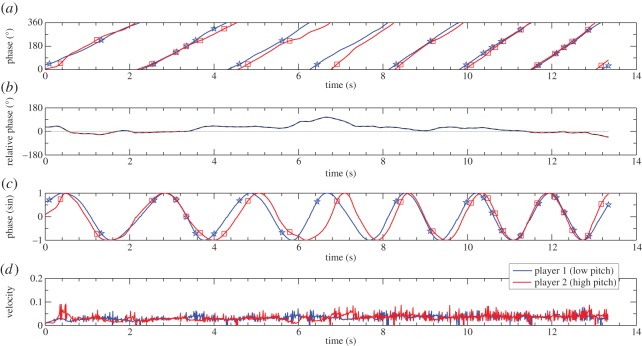
Figure 3.
Real-time movement dynamics of two E-music box players. The figure shows representative data from one trial. The blue line indicates the rotatory movements performed by the low-pitch player, and the red line indicates the movements performed by the high-pitch player. (a) Phase expressed in degrees (between 0 and 360); (b) relative phase (the colour indicates which player’s movements are produced earlier); (c) phase expressed in sine; and (d) rotation velocity. Markers indicate when the musical tones are produced.

