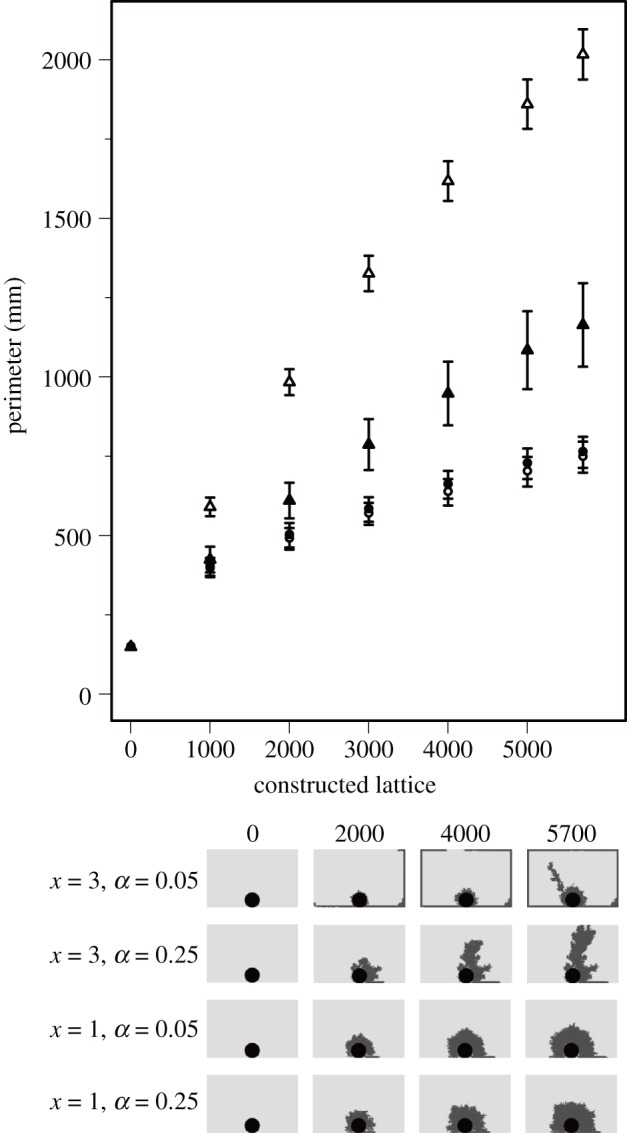
Figure 5.

The building process of patterns generated in construction simulations with 400 workers. Different shapes represent differences in sensitivity to the cement pheromone (circle, x=1; triangle, x=3). Different colours represent differences in the rates of active workers (white, α=0.05; black, α=0.25). Bars represent means±s.d.
