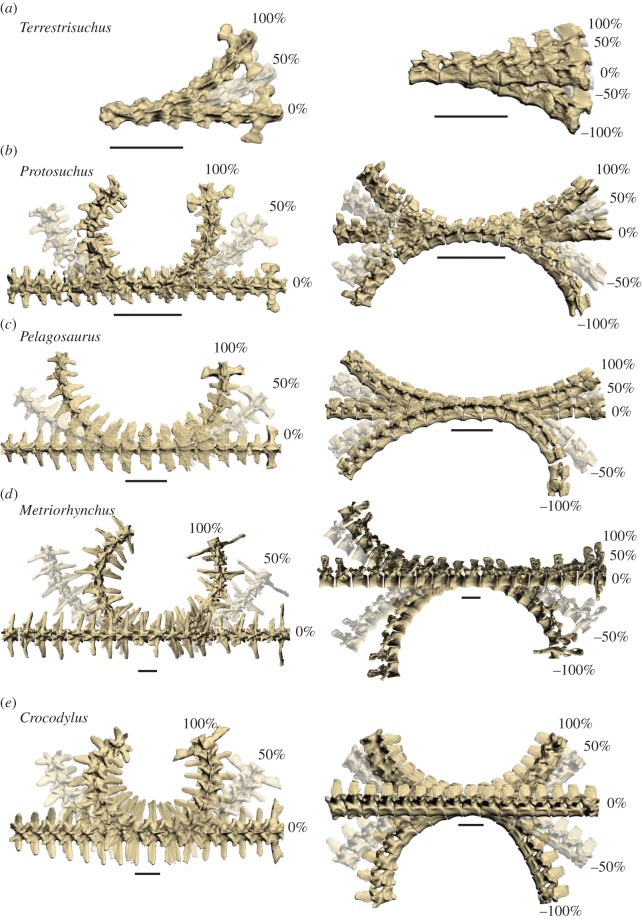
Figure 8.
Osteological RoM estimates extrapolated to the entire thoracolumbar vertebral column. In the left column are dorsal views showing lateral flexion, and in the right column are lateral views showing dorsoventral flexion. Cranial is to the left. The RoM of each joint is equal to that of the nearest joint that we tested, disregarding the lumbosacral joint (RoM of the lumbosacral joint was applied only to that joint). Percentages are relative to maximum osteological RoM. Scale bar, 5 cm.

