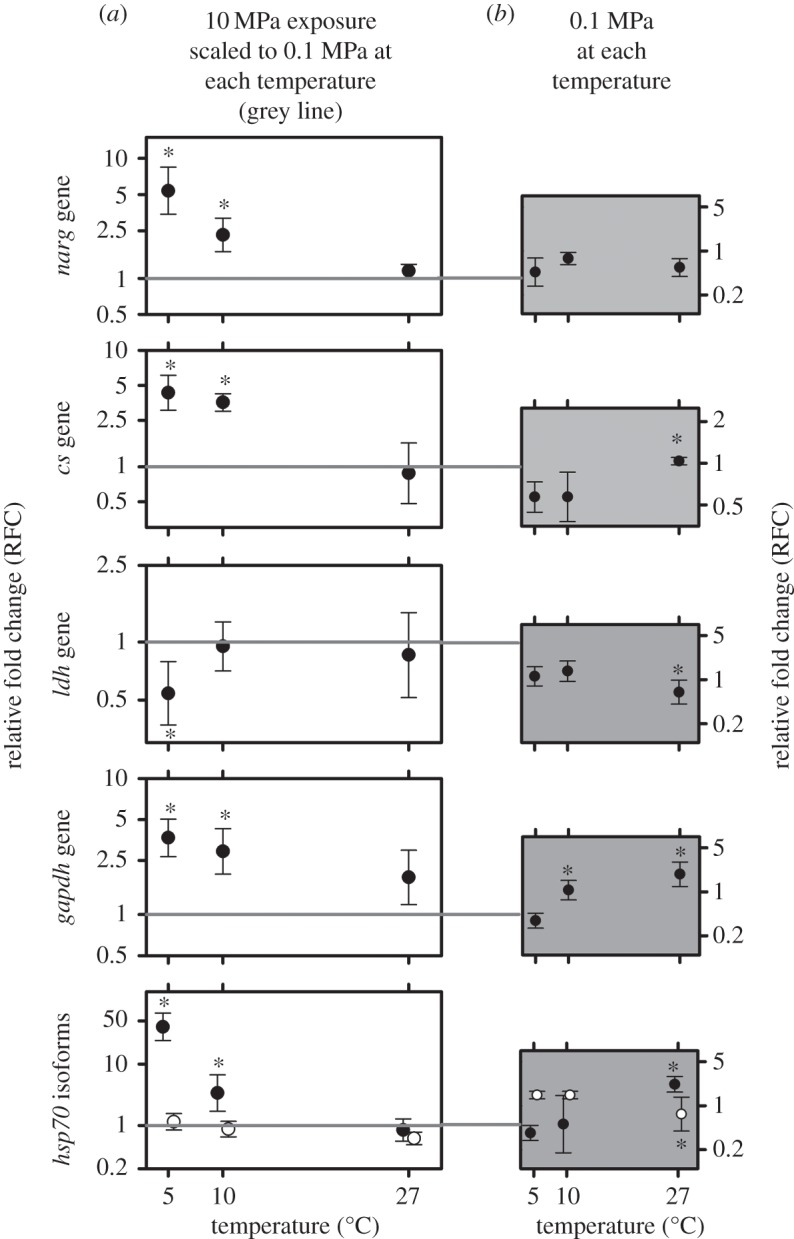
Figure 1.

Relative fold change (RFC) of six genes after 168 h exposures at 0.1 MPa and 10 MPa at three temperatures: 5, 10 and 27°C. (a) RFCs of each named gene (hsp70 f1 isoform—black dots, hsp70 f2 isoform—white dots) at 10 MPa compared with 0.1 MPa at 5, 10 and 27°C. RFCs are scaled to gene expression at the corresponding temperature at 0.1 MPa, represented by the grey line in each graph. (b) Unscaled averaged RFCs at 0.1 MPa at 5, 10 and 27°C (represented by straight grey line in a). RFCs and 95% CIs calculated from five biological replicates. Significance displayed as *p<0.05 determined by a GLM and a post hoc Tukey-HSD test.
