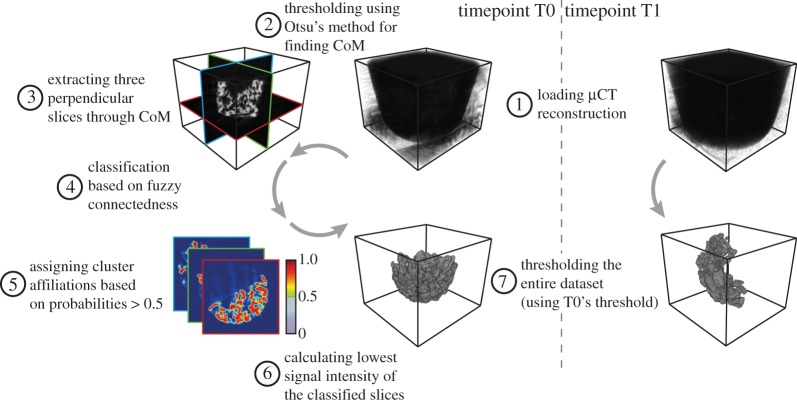
Figure 2.
Schematic of the construct segmentation algorithm. After loading the three-dimensional μCT reconstruction of time-step T0 (1), its CoM was calculated (2). The CoM represents the reference point for the extraction of three orthogonal slices used for the construct classification (3). For each voxel of these slices, cluster-affiliation probabilities were calculated based on the voxels’ connectedness in terms of signal intensity (4). By thresholding the cluster-affiliation probabilities, the classification was transformed from a continuous to a binary classification (5). The three orthogonal slices were then masked with the binary classification and the lowest signal intensity was obtained (6). This signal intensity was then used to threshold the complete three-dimensional μCT reconstruction (7). To be able to compare T0 and T1 of the same construct, T1 was segmented using the same threshold as T0.

