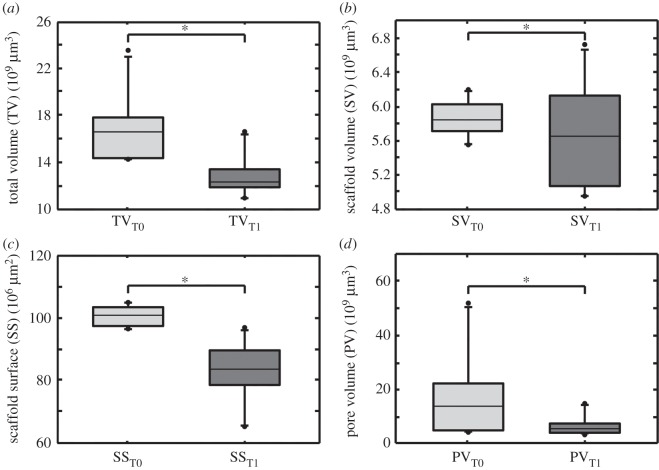
Figure 4.
Boxplots illustrating change of total volume (TV), scaffold volume (SV), scaffold surface (SS) and pore volume (PV) over time. Boxplots are designed as median±interquartile range (IQR); range from highest and lowest value within 75th percentile±1.5 IQR; points are illustrating outliers. (a) TV at T0 compared to TV at T1. Differences were significant (p<0.0001); (b) SV at T0 compared to PN at T1. Differences were not significant (p=0.219); (c) SS at T0 compared to SS at T1. Differences were significant (p<0.0001); (d) PV at T0 compared to PV in T1. Differences were significant (p=0.0439).

